International Chemistry Olympiad
IChO 2023
Zurich, Switzerland · 10 theory problems with complete solutions
Problem 1: Molecular Imaging
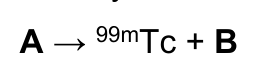
Molecular imaging is a powerful tool in medical diagnostics. The nuclear isomer \(\ce{^{99m}Tc}\) (m = metastable) of the isotope \(\ce{^{99g}Tc}\) (g = ground state) has excellent radiation properties (\(\gamma\)-emitter, \(t_{1/2}=6.015\ \mathrm{h}\)) for radioimaging. \(\ce{^{99m}Tc}\) is obtained by \(\beta^-\) decay of a mother nuclide in a so-called technetium generator as \(\ce{^{99m}Tc}\)-pertechnetate \(\ce{[^{99m}TcO4]^-}\).
1.1 Identify the mother nuclide (A) of \(\ce{^{99m}Tc}\) and the emitted particle (B).
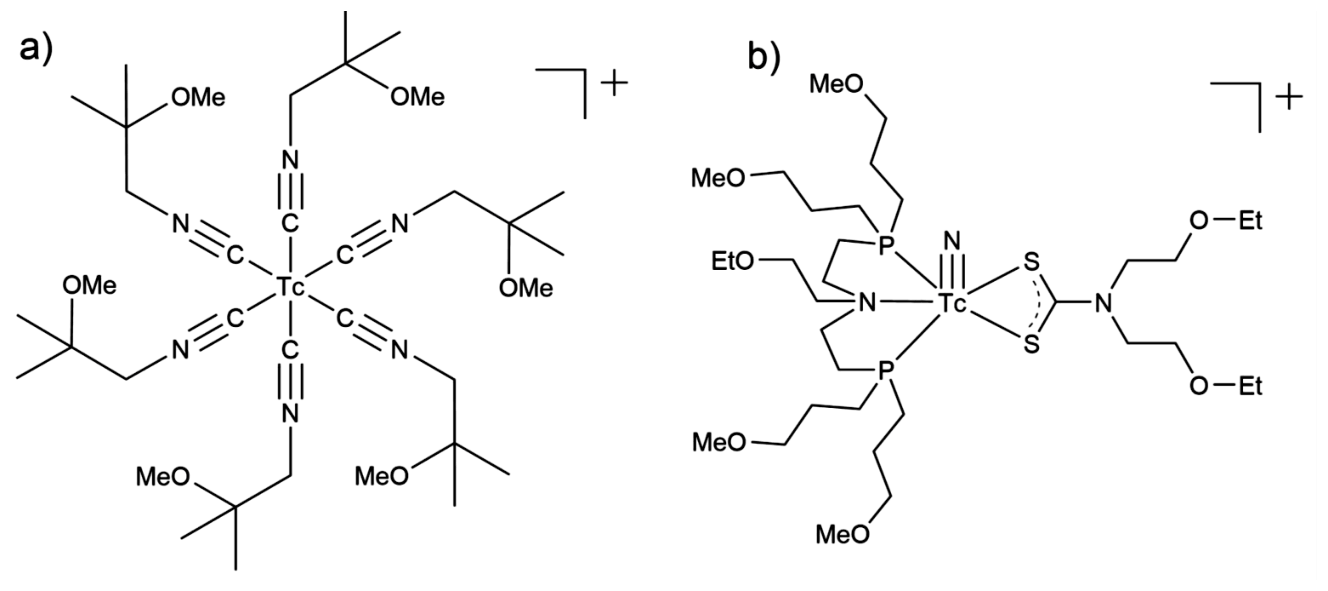
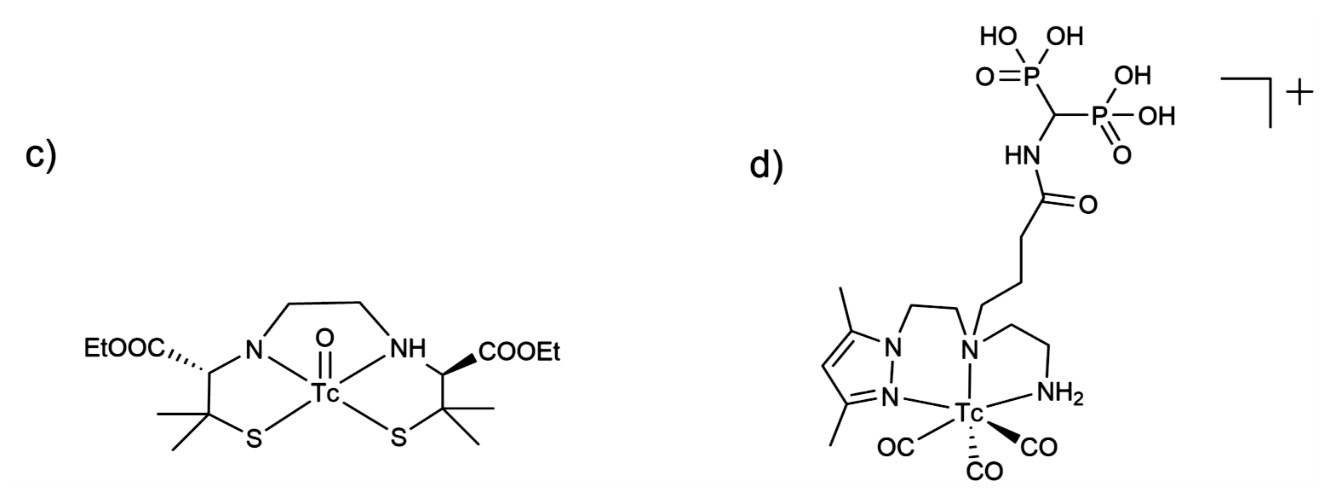
1.2 Provide the oxidation states of the radiometal in the following \(\ce{^{99m}Tc}\)-probes.
The redox potentials of the group seven elements manganese (\(\ce{Mn}\)), technetium (\(\ce{Tc}\)) and rhenium (\(\ce{Re}\)) follow the general trend in the periodic tables (see Figure 2 below).
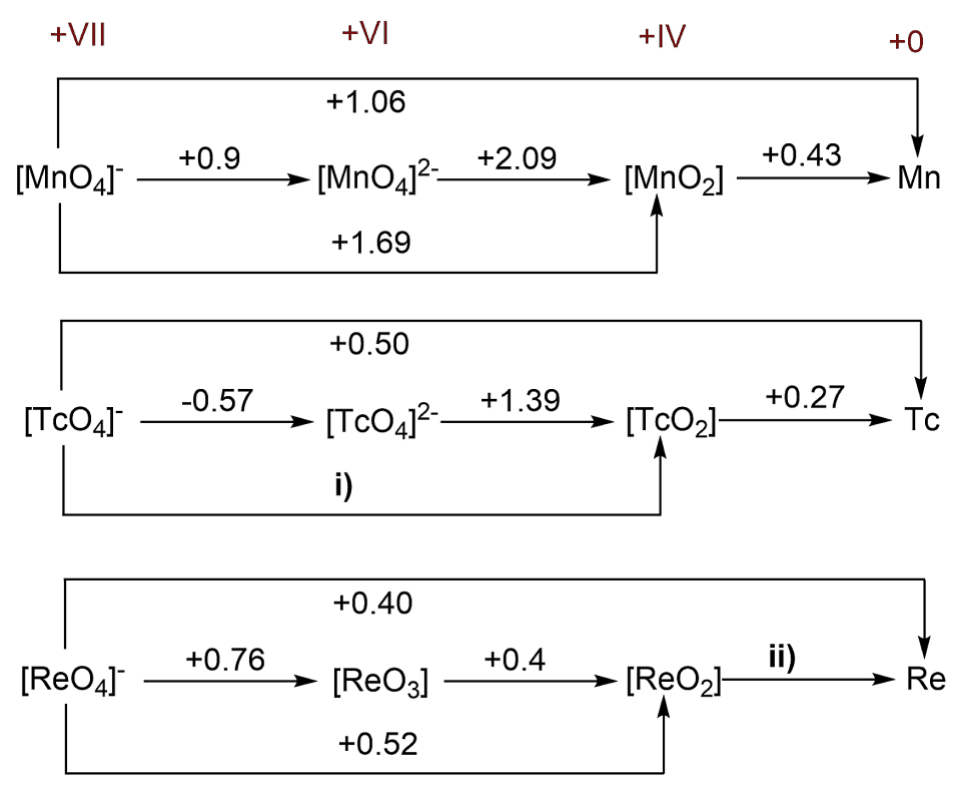
Figure 2
1.3 Calculate the two missing redox potentials i and ii.
1.4 Compare \(\ce{[MnO4]^-}\), \(\ce{[TcO4]^-}\) and \(\ce{[ReO4]^-}\). Chose the strongest oxidizing agent.
1.5 Based on the values indicated by Figure 2 in the question sheet, select if \(\ce{TcO2}\) would disproportionate to \(\ce{Tc}\) and \(\ce{TcO4^2-}\) under acidic conditions.
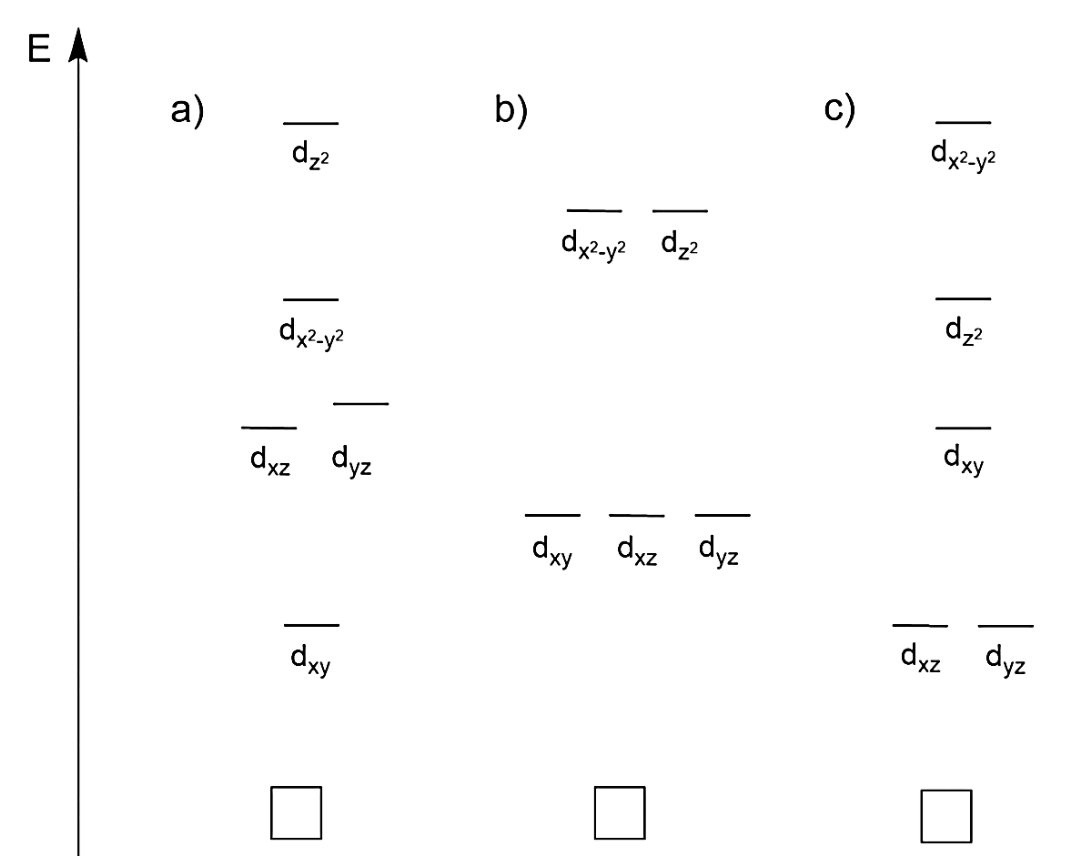
\(\ce{Tc}\) and \(\ce{Re}\) complexes at the oxidation state +V (\(d^2\) systems) which contain a terminal oxo- (\(\ce{O=}\)) or nitrido ligand (\(\ce{N#}\)) are diamagnetic. The scheme below shows three possible molecular orbital energy diagrams.
1.6 Choose which orbital energy diagram explains the observed diamagnetism. Draw the corresponding electron configuration in the correct diagram.
\(\ce{((C4H9)4N)[^{99g}TcO4]}\) is a colorless powder. By the addition of conc. \(\ce{HCl}\) this common starting compound for \(\ce{^{99g}Tc}\) chemistry is converted into the green complex \(\ce{((C4H9)4N)[^{99g}TcOCl4]}\).
1.7 Write down both oxidation and reduction half-reactions using the formulas of ions or neutral molecules, and the complete redox reaction.
All \(\ce{^{99m}Tc}\) radiotracers in clinics are prepared in “one pot” reactions, applying commercialized kits. Typically (\(\ce{^{99m}Tc}\) \(t_{1/2}=6.015\ \mathrm{h}\)), an eluate of a \(\ce{^{99m}Tc}\) generator has an activity of 12.5 GBq (GBq = gigabecquerel = \(10^9\) decays per second).
1.8 Calculate how many moles of \(\ce{^{99m}Tc}\) are present in such samples.
For standard imaging, around 200 MBq \(\ce{^{99m}Tc}\) are administered to the patient.
1.9 Assume that no activity is lost through excretion. Calculate how many hours the patient has to wait until the injected activity decreases to under 1 % of the starting activity.
Bioconjugation of radiometals is a chemical challenge. A recent example is the (3 + 2) cycloaddition of \(\ce{[^{99m}TcO3(tacn)]+}\) (A) (tacn = 1,4,7-triazacyclononane) with alkenes. In this context (3 + 2) refers to the number of atoms involved and not to the numbers of electrons. The following scheme shows an example of this reaction by labeling a protected carbohydrate.
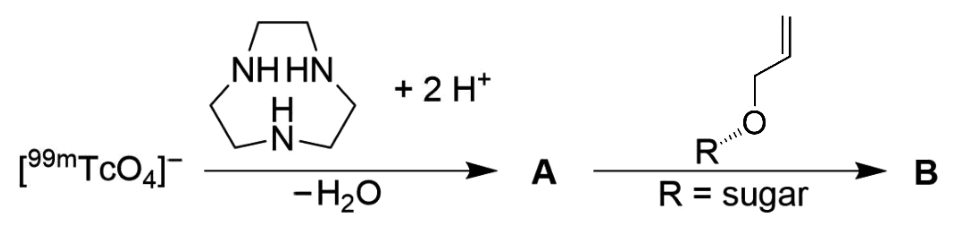
1.10 Draw the structures of compound A and B. Further, state the oxidation state of the technetium in these compounds.
Official English text of the problem.
Problem 2: Electrochemical CO2 Reduction
Electrochemical \(\ce{CO2}\) reduction
In recent years, the electrochemical conversion of \(\ce{CO2}\) into higher value products has been considered a promising and technologically feasible approach to mitigate the negative climatic effects caused by its increasing levels in the atmosphere. Several technologies have been developed to achieve this goal. Among these, \(\ce{CO2}\) reduction through electrochemical means (\(\ce{CO2}\)RR) warrants particular attention due to its ability to be powered by renewable energy to transform environmentally harmful \(\ce{CO2}\) into platform chemicals. Electrocatalysts are essential not only to accelerate the intrinsically slow \(\ce{CO2}\)RR but also to direct the electrolysis reaction towards the desired reaction products. In this context, it is not only the chemical nature of the catalyst itself which governs the resulting \(\ce{CO2}\)RR product distribution but also its morphological characteristics on various length scales. A new concept of \(\ce{CO2}\)RR catalyst design relies on the electrodeposition of foam-type materials, which offer a large surface area that is accessible to reactants (e.g. \(\ce{H2O}\), \(\ce{H2}\), and \(\ce{CO2}\)). Copper-based materials are the only known metallic \(\ce{CO2}\)RR catalysts that can produce hydrocarbons and alcohols in significant amounts by \(\ce{CO2}\) electrolysis.
Given below are thermodynamic data of selected substances:
\(\Delta_\mathrm{f}H^\ominus\) (\(\mathrm{kJ\,mol^{-1}}\)) \(S^\ominus\) (\(\mathrm{J\,K^{-1}\,mol^{-1}}\)) \(\ce{H2O(l)}\) −285.83 69.95 \(\ce{O2(g)}\) 0 205.15 \(\ce{H2(g)}\) 0 130.68 \(\ce{CO2(g)}\) −393.52 213.79 ethanol(l) −276.00 159.86 n-propanol(l) −302.54 192.80 Table 1. Standard formation enthalpy \(\Delta_\mathrm{f}H^\ominus\) and standard entropy \(S^\ominus\) for some substances under standard conditions (\(T=298.15\ \mathrm{K}\), \(p^\ominus=1\ \mathrm{bar}\))
Cell reaction \(E^\ominus\) vs. SHE (V) \(\ce{Cu^2+ + 2e- = Cu}\) +0.34 \(\ce{2H+ + 2e- = H2}\) 0.00 Table 2. Selected half-cell reactions and standard potentials under standard conditions
2.1 Write and balance the chemical equation of the half-cell reactions for the following electrochemical reduction processes in acidic environment: (i) \(\ce{CO2}\) to ethanol; (ii) \(\ce{CO2}\) to n-propanol.
2.2 Combine the half-cell of the reduction process with an \(\ce{H2}/\ce{2H+}\) half-cell where the latter acts as anode. Calculate the value of the standard cell potential of the \(\ce{CO2}\) to ethanol reduction.
2.3 Write all the reduction and oxidation half-cell reactions taking place at the cathode and the anode, respectively.
Figure 1 shows the principle of dynamic hydrogen bubble-templated metal deposition.
Figure 2 displays top-down scanning electron microscopy images of five different \(\ce{Cu}\) foams obtained upon interruption of the metal deposition at different times: 5 s, 20 s, 80 s.
\(\ce{Cu}\) foam electrodeposition processes (see Figure 1) were carried out in an aqueous 1.5 M sulfuric acid solution containing 0.2 M copper sulfate (\(\ce{CuSO4 * 5H2O}\)) as the copper source. A \(\ce{Cu}\) disk (\(1\ \mathrm{cm^2}\)) and a \(\ce{Pt}\) foil served as the cathode and the anode, respectively.
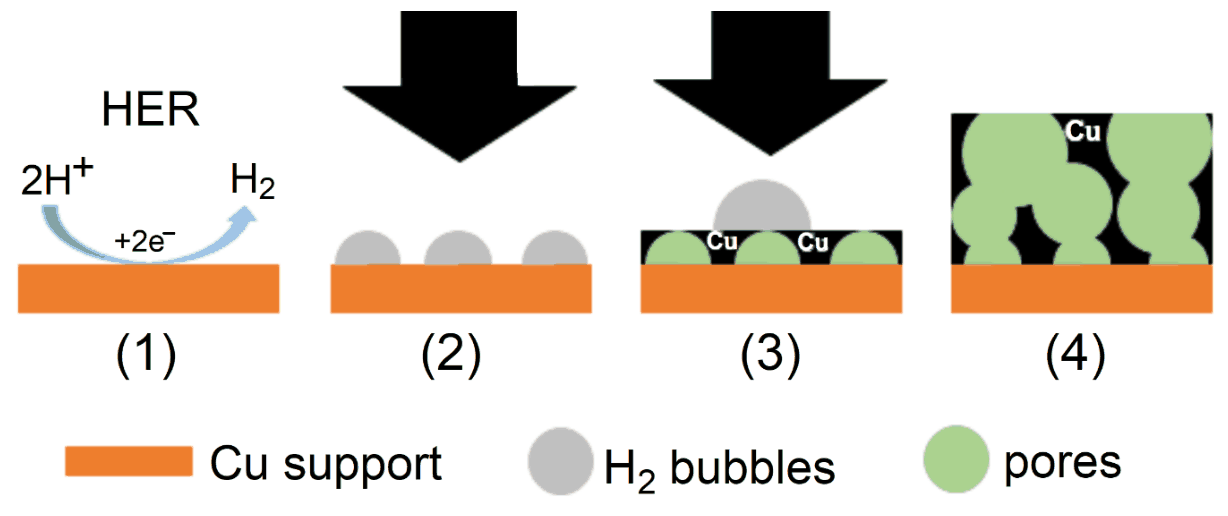
Figure 1. Depiction of the electrodeposition of foam-type materials. In the course of electrochemical metal deposition (black arrows) at high current densities in aqueous media, the Hydrogen Evolution Reaction (HER) takes place on the metallic (\(\ce{Cu}\)) support (1). The surface becomes thus partially covered by \(\ce{H2}\) bubbles (2). The \(\ce{H2}\) bubbles act as a template for metal deposition (3). As a result a highly porous metal foam emerges (4)
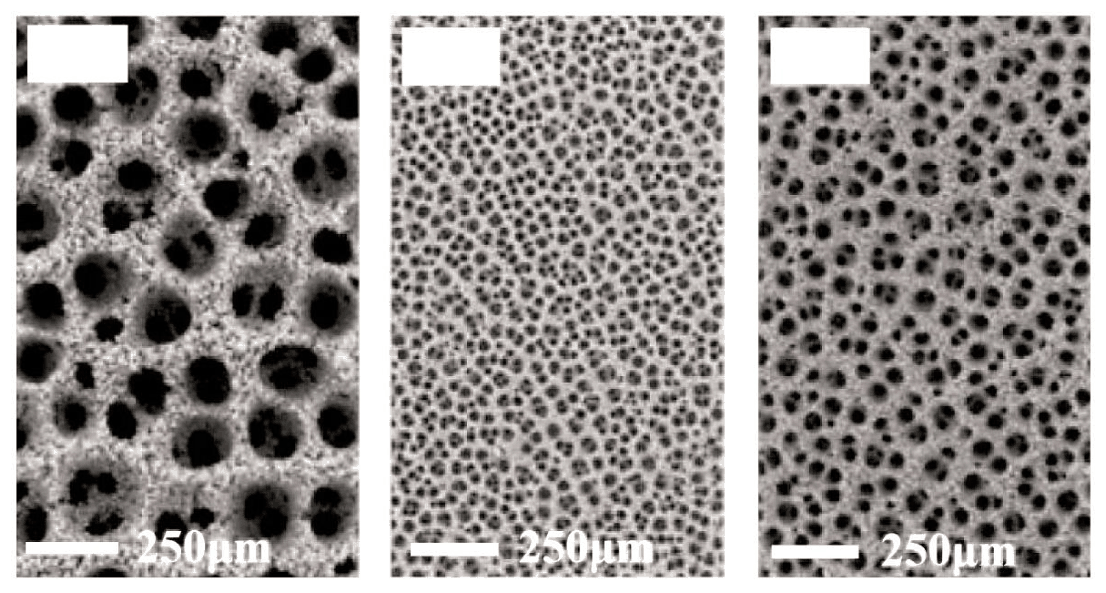
Figure 2. \(\ce{Cu}\) foams obtained by galvanostatic \(\ce{Cu}\) electrodeposition at a current density of \(j=-3\ \mathrm{A\,cm^{-2}}\). The deposition was, in each case, interrupted at distinct elapsed duration: 5 s, 20 s and 80 s. The scale bar is the same in all panels
2.4 Considering this mechanism, assign the correct deposition time to the \(\ce{Cu}\) foams shown in Figure 2 on the answer sheet (white boxes upper left corner).
Bimetallic \(\ce{CuAg}\) systems are excellent catalysts for the electrosynthesis of alcohols from \(\ce{CO2}\). 5.4 mg of a bimetallic \(\ce{Cu}\)-\(\ce{Ag}\) foam catalyst (90 wt. % \(\ce{Cu}\), \(M_{\ce{Cu}}=63.546\ \mathrm{g\,mol^{-1}}\); 10 wt. % \(\ce{Ag}\), \(M_{\ce{Ag}}=107.868\ \mathrm{g\,mol^{-1}}\)) was galvanostatically deposited onto a \(\ce{Cu}\) foil (\(1\ \mathrm{cm^2}\)) at a current density of \(j=-3\ \mathrm{A\,cm^{-2}}\) applied for 20 s (the minus sign accounts for a reductive/cathodic process).
2.5 Calculate the Faradaic efficiency (FE in %) of this metal deposition process. FE is defined as \((Q_\mathrm{product}/Q_\mathrm{total})\times100\%\), where \(Q\) denotes the charge.
We consider a \(\ce{CO2}\) electrolysis experiment carried out in 35 mL \(\ce{CO2}\)-saturated 0.5 M \(\ce{KHCO3}\) electrolyte solution over the bimetallic \(\ce{Cu}\)-\(\ce{Ag}\) foam catalyst (90 wt. % \(\ce{Cu}\); 10 wt. % \(\ce{Ag}\)). The \(\ce{CO2}\) electrolysis was carried out at a constant (total) current density of \(j(\mathrm{tot})=-30\ \mathrm{mA\,cm^{-2}}\) for 3600 s (note the current density is normalized to the geometric surface area of \(1\ \mathrm{cm^2}\); the minus sign accounts for a reductive/cathodic process). A product analysis, carried out after the electrolysis, revealed mass concentrations of \(41.3\ \mathrm{mg\,L^{-1}}\) and \(7.4\ \mathrm{mg\,L^{-1}}\) for ethanol and n-propanol, respectively. Both alcohols are liquid reaction products and accumulate in the electrolyte in the course of the electrolysis reaction. We assume that gaseous hydrogen (\(\ce{H2}\)) is formed as the only by-product of the process.
2.6 Calculate the current densities required for the formation of (a) ethanol (\(M_\mathrm{EtOH}=46.08\ \mathrm{g\,mol^{-1}}\)) and (b) n-propanol (\(M_\mathrm{PrOH}=60.10\ \mathrm{g\,mol^{-1}}\)) assuming that the current densities do not change with electrolysis time.
2.7 Calculate the volume of the formed hydrogen on the \(1\ \mathrm{cm^2}\) catalyst area at 298.15 K and 1 bar, assuming ideal behavior of the formed hydrogen, and its complete release into the gas phase. If you did not get a result in Task 2.6, continue with FE(EtOH) = 45,1 % and FE(PrOH) = 4.8 %.
Official English text of the problem.
Problem 3: Artificial Photosynthesis
The field of artificial photosynthesis research aims at storing solar energy in chemical bonds. Photons are absorbed by exciting sensitizers, thereby producing a charge-separated state. The excited electron is transferred to a catalyst (hydrogen evolving catalyst, HEC), which is reduced twice and then produces \(\ce{H2}\). The photosensitizer or light absorber is often \(\ce{[Ru(bpy)3]^2+}\) (bpy = 2,2'-bipyridine), and the HECs are often cobalt complexes.
Energetics of Water Splitting
3.1 Calculate the enthalpy of the reaction \(\ce{H2 -> 2H+(aq) + 2e-}\).
Solvation enthalpy of proton: \(\Delta_{\mathrm{aq}}H(\ce{H+})=-1190\ \mathrm{kJ\,mol^{-1}}\)
Ionization energy of hydrogen: \(IE_1=13.6\ \mathrm{eV}\)
Dissociation enthalpy of \(\ce{H2}\): \(\Delta_{\mathrm{diss}}H(\ce{H2})=432\ \mathrm{kJ\,mol^{-1}}\)
Ideally, electrochemical water splitting into \(\ce{O2}\) and \(\ce{H2}\) runs at 1.23 V. Since \(T\Delta S\) for this process is positive, heat from the environment is needed. If additional voltage produces the heat required to compensate the decrease in temperature the process is called thermoneutral. The enthalpy of \(\ce{H2O}\) formation, \(\Delta_{\mathrm f}H^\circ(\ce{H2O})\), is \(-285\ \mathrm{kJ\,mol^{-1}}\).
3.2 Calculate (a) the water splitting reaction entropy \(\Delta_{\mathrm r}S^\circ\) at 25 °C of 1 mol of \(\ce{H2O}\) and (b) the voltage at which water splitting is thermoneutral.
Catalysts
Cobalt–salen (salcomin) type complexes are potential catalysts for \(\ce{H2}\) formation from protons and electrons. The structure of salcomin is given below:
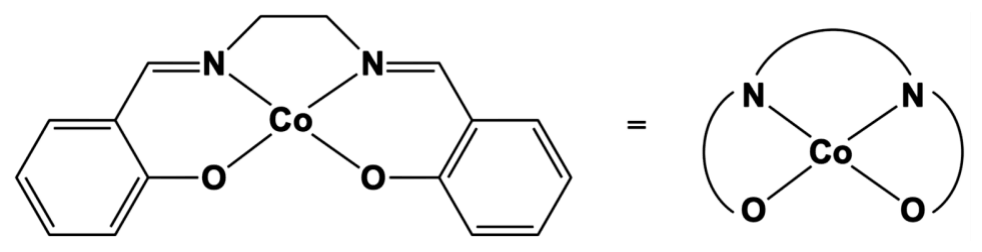
Figure 1. The structure of salcomin
3.3 Determine the oxidation state of the cobalt atom in salcomin. Determine the geometric structure around the cobalt center of salcomin, choosing from these three possibilities: tetrahedral, square planar or octahedral.
In solution, salcomin can bind \(\ce{O2}\); that links two salcomin moieties by coordinating to the two Co centers. The oxidation state of both Co centers is then +III.
3.4 Draw the resulting structure.
The \(\ce{H2}\) formation takes place exclusively at the cobalt center. The reaction is described by a 4-step catalytic cycle starting with \(\ce{Co^2+}\) using 2 \(\ce{H+}\) and 2 electrons. During one step a hydride is formed by an intramolecular electron transfer.
3.5 Write down two possible variations of the catalytic cycle with charges of the complex and oxidations states of the Co center. The oxidation state on the Co center should not be larger than +III. Mark the hydride formation step with an asterisk and label \(\ce{H+}\) uptake with C (chemical reaction), and electron uptake with E (electrochemical reaction), see example cycle in Figure 2 below. \(\ce{[Co^{II}]}\) stands for the Cobalt–salen complex.
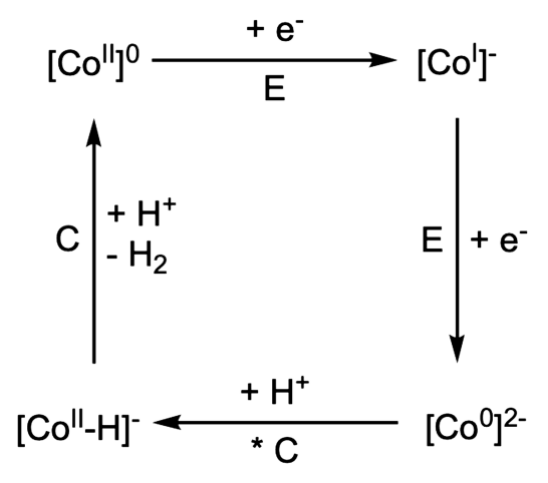
Figure 2. An example cycle for task 3.5
3.6 Using the redox potential values of different cobalt complexes given in Table 1, write down which complex is suitable for a) water oxidation at neutral pH b) water reduction at neutral pH. Write down the corresponding overall reaction for both processes (only for the complexes, capable of performing it) and calculate the cell potential at neutral pH. The half-cell potential for the proton reduction at pH = 7, \(T=298\ \mathrm K\) is \(-0.41\ \mathrm V\).
Co(III/II) redox couple \(E^\circ\) vs. normal hydrogen electrode \(\ce{[Co(H2O)6]}^{3+/2+}\) \(+1.92\ \mathrm V\) \(\ce{[Co(C2O4)3]}^{3-/4-}\) \(+0.55\ \mathrm V\) \(\ce{[Co(EDTA)]}^{1-/2-}\) \(+0.38\ \mathrm V\) \(\ce{[Co(NH3)6]}^{3+/2+}\) \(+0.06\ \mathrm V\) \(\ce{[Co(en)3]}^{3+/2+}\) \(-0.18\ \mathrm V\) \(\ce{[Co(CN)5]}^{2-/3-}\) \(-0.60\ \mathrm V\) Table 1. Possible redox couples for task 3.6; \(\ce{[C2O4]^2-}\) = oxalate, en = 1,2-ethylendiamine.
A Glimpse at the Natural Process
The natural storage of biological \(\ce{H2}\) equivalents is NADPH, which is produced from \(\ce{NADP+}\) through the addition of a hydride ion. The structure of NADPH is shown in Figure 3.
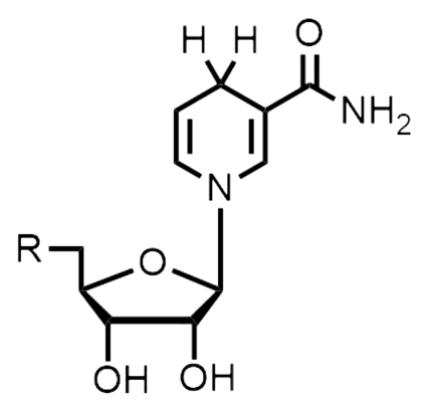
Figure 3. The structure of NADPH
3.7 Draw the structure of \(\ce{NADP+}\).
Chlorophyll has an extinction coefficient of about \(\varepsilon=8\times10^4\ \mathrm{M^{-1}\,cm^{-1}}\) at 680 nm.
3.8 Assuming an efficiency (photon to hydrogen atom) of \(\phi=20\ \%\) at a 680 nm photon flux of \(100\ \mathrm{nE\,s^{-1}\,cm^{-2}}\) (1 E = 1 mol of photons), calculate a) the number of photons per second and b) the concentration of chlorophyll in a \(1\times1\times1\ \mathrm{cm^3}\) cell needed to get a turnover frequency of \(1\ \mathrm{nmol}\ (\ce{H2})\ \mathrm{s^{-1}}\).
Official English text of the problem.
Problem 4: Fluorinated and Hypervalent Compounds
Fluorine forms stable and isolable compounds with essentially all elements, including the noble gases \(\ce{Kr}\) and \(\ce{Xe}\). Fluorine-containing molecules often feature uncommon structures. Thus, fluorine is frequently involved in the formation of compounds with elements of groups 14–18, which are defined as hypervalent. The synthesis of fluorinated organic compounds is nowadays heavily based on the availability of specifically designed reagents, compound 4 below being an example.
Hint: Any element \(E\) in the series \(\mathbf{E^1}\)–\(\mathbf{E^8}\) may be represented more than once.
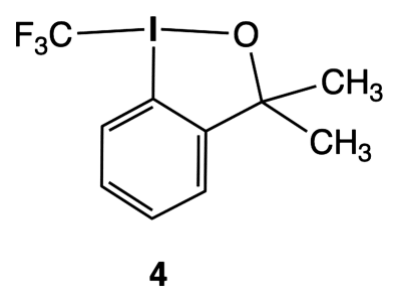
Part I. Molecular geometry
4.1 Identify elements \(\mathbf{E^1}\), \(\mathbf{E^2}\), \(\mathbf{E^3}\), and \(\mathbf{E^4}\) in the three species 1, \(\mathbf{[2]^-}\), and \(\mathbf{[3]^-}\).
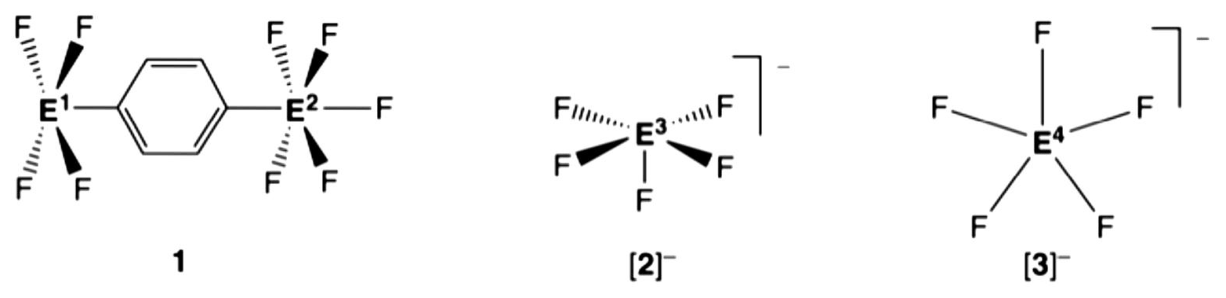
1: neutral, non-zwitterionic molecule, \(\mathbf{E^1}\) square pyramidal, \(\mathbf{E^2}\) octahedral, average \(d(E^1\!-\!\ce{F})=1.91\ \text{Å}\); average \(d(E^2\!-\!\ce{F})=1.58\ \text{Å}\)
\(\mathbf{[2]^-}\): anion, square pyramidal, average \(d(E^3\!-\!\ce{F})=1.96\ \text{Å}\)
\(\mathbf{[3]^-}\): anion, pentagonal planar, \(d(E^4\!-\!\ce{F})=1.98\ \text{Å}\)
Hints:
- The molecular geometries refer to the arrangement of atoms bonding to \(E^1\)–\(E^4\)
- The elemental analysis of 1 gives a carbon content of 17.75 % wt.
Group 15 Group 16 Group 17 Group 18 \(d(\ce{P-F})=1.50\text{–}1.68\ \text{Å}\) \(d(\ce{S-F})=1.52\text{–}1.60\ \text{Å}\) \(d(\ce{Cl-F})=1.63\text{–}1.85\ \text{Å}\) \(d(\ce{As-F})=1.68\text{–}1.72\ \text{Å}\) \(d(\ce{Se-F})=1.75\text{–}1.80\ \text{Å}\) \(d(\ce{Br-F})=1.77\text{–}1.97\ \text{Å}\) \(d(\ce{Kr-F})=1.77\text{–}1.89\ \text{Å}\) \(d(\ce{Sb-F})=1.85\text{–}2.05\ \text{Å}\) \(d(\ce{Te-F})=1.80\text{–}2.00\ \text{Å}\) \(d(\ce{I-F})=1.90\text{–}2.00\ \text{Å}\) \(d(\ce{Xe-F})=1.77\text{–}2.00\ \text{Å}\) Table 1. Typical \(\ce{E-F}\) bond distance ranges for a selection of elements in groups 15–18
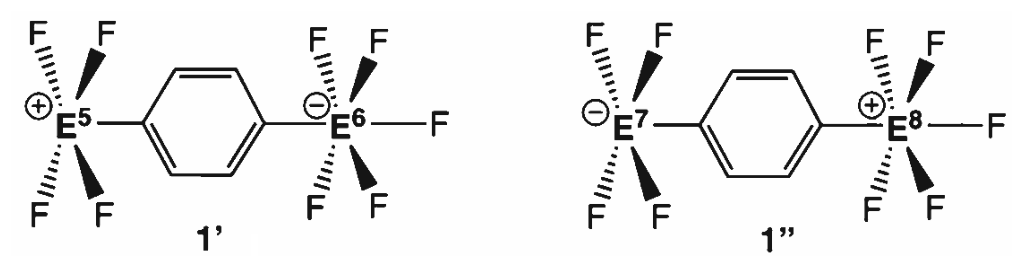
4.2 Choose which elements \(\mathbf{E^5}/\mathbf{E^6}\) and \(\mathbf{E^7}/\mathbf{E^8}\), respectively, would display the given geometry, including \(\ce{E-F}\) bond distances close to those in 1 (see Table 1).
Part II. Reactivity and structure
Consider the reaction shown below:
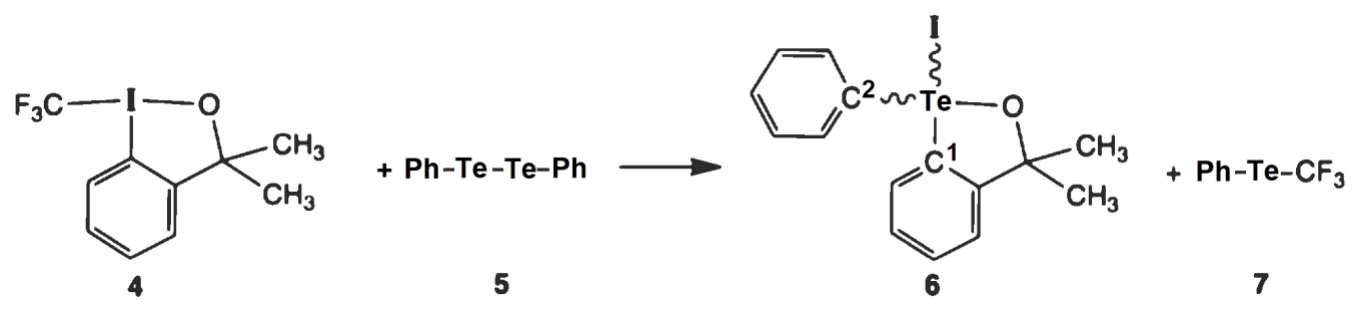
4.3 Choose the ideal geometry of compound 6 in terms of the arrangement of the valence-shell electron-pair domains around the \(\ce{Te}\) atom:
- square planar
- square pyramidal
- trigonal bipyramidal
- tetrahedral
- octahedral
Provide the expected ideal bond angles \(C^1\!-\!\ce{Te}\!-\!\ce{I}\), \(C^2\!-\!\ce{Te}\!-\!\ce{I}\), \(\ce{I-Te-O}\), and \(C^1\!-\!\ce{Te}\!-\!C^2\).
4.4 Write the number \({}^{1}\mathrm{H}\)-NMR signals you expect for the two methyl groups in compounds 4 and 6, respectively.
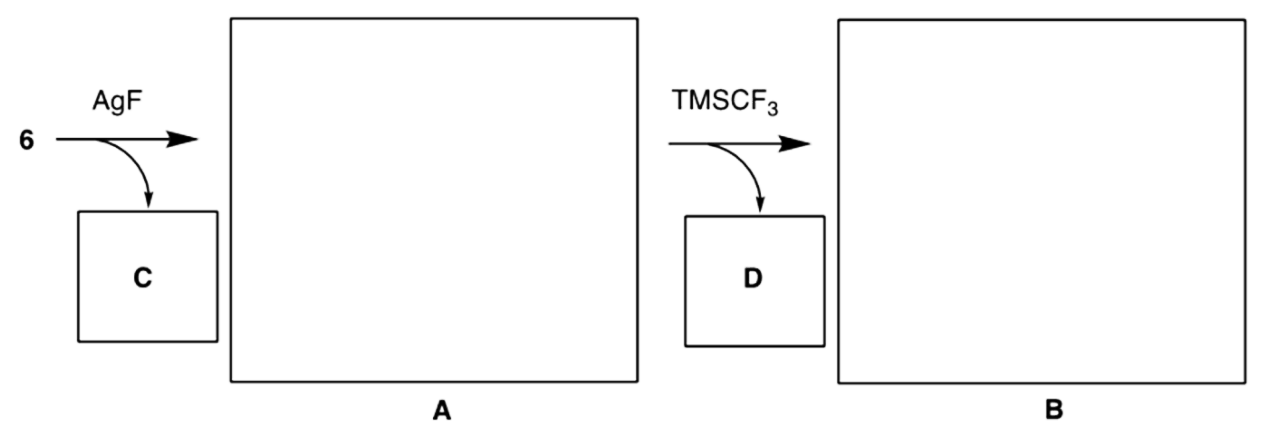
4.5 Compound 6 reacts consecutively with \(\ce{AgF}\) and \(\ce{(H3C)3SiCF3}\) (\(\ce{TMSCF3}\)). Formulate the \(\ce{Te}\)-containing intermediate A and final product B, including their correct geometry, as well as the byproducts C and D. Draw A and B and write the by-products C and D. Hint: molecular weight of D is \(92.08\ \mathrm{g\,mol^{-1}}\).
Assume that compound 6 reacts with a sterically bulky, chiral, enantiomerically pure Lewis acid, such as the known boron derivative 8, as shown below. This reaction should lead to the formation of a new product 9, the composition of which corresponds to the sum of 6 and 8. Further assume that 9 is a salt, in which the cation derives from 6 and the anion from 8.
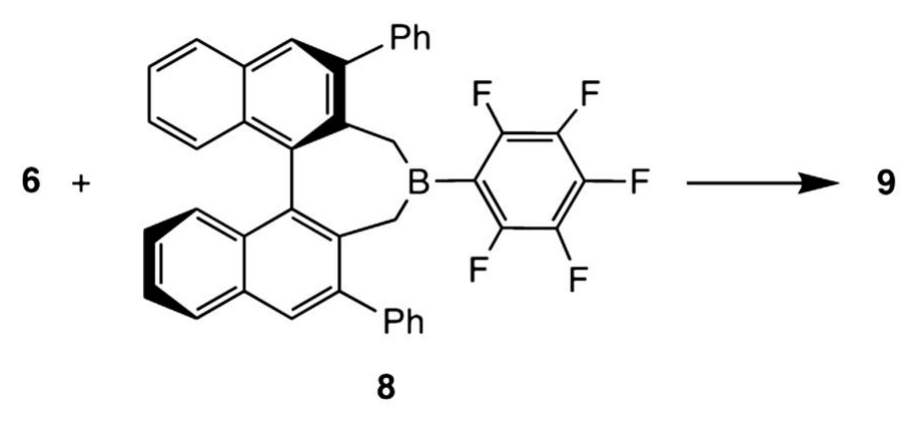
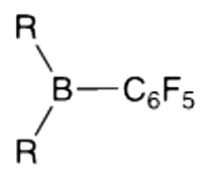
4.6 Draw the structure of both the \(\ce{Te}\)-containing cation and the boron-containing anion and choose the ideal geometry of the cation in terms of the arrangement of the valence-shell electron-pair domains around the \(\ce{Te}\) atom.
Hint: For 8 (chiral, enantiomerically pure) use the following schematic representation:
Choose the ideal molecular geometry of the cation:
- square-planar
- trigonal-planar
- trigonal-pyramidal
- trigonal-bipyramidal
- tetrahedral
4.7 State the number of possible stereochemically different salts 9.
Part III. Synthesis of a \(\lambda^3\)-difluoroiodane and rotation around a single bond
Compound 10 is prepared from starting material 8 by oxidation with trichloroisocyanuric acid (TCICA, 9) in the presence of excess \(\ce{KF}\) in dry acetonitrile as shown below.
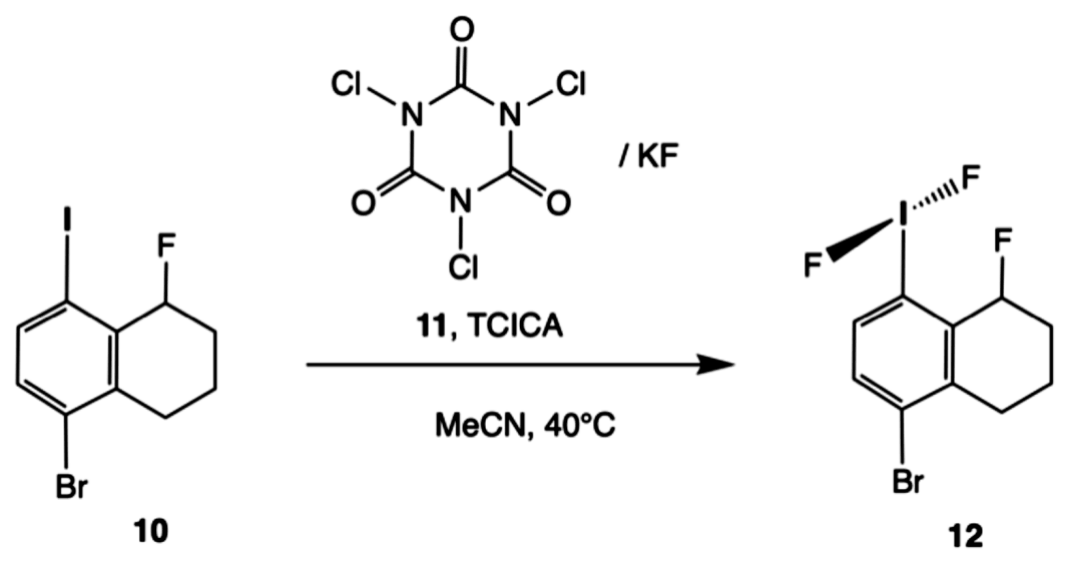
4.8 Write balanced half-cell reactions and a balanced overall reaction for this process.
Hint: Abbreviate 10 as \(\ce{R-I}\), 11 as \(\ce{R-IF2}\), and TCICA as \(\ce{C3Cl3N3O3}\). The six-membered ring of TCICA stays intact upon reduction.
The \(\ce{IF2}\) group in 12 can rotate around the \(\ce{I-C}\) bond (imagine a molecular propeller). The corresponding rotation barrier has been measured experimentally, \(E_\mathrm{a}=30\ \mathrm{kJ\,mol^{-1}}\). Furthermore, the rate constant for the rotation is \(k=2500\ \mathrm{s^{-1}}\) at \(228\ \mathrm{K}\).
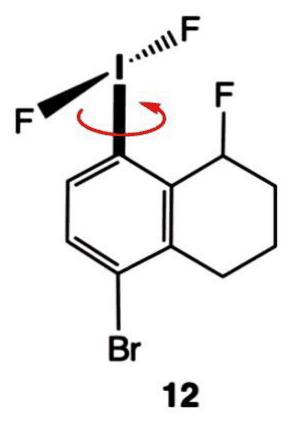
4.9 Determine how fast the \(\ce{IF2}\) group can in principle rotate at room temperature (\(298\ \mathrm{K}\)). Consider this process as if it were a chemical reaction for which you are determining the rate constant. Write your answer on the answer sheet. The unit of the constant should be given in \(\mathrm{s^{-1}}\).
Official English text of the problem.
Problem 5: Hydrodesulfurization
The production of sulfur-free fuels is the general trend towards lowering the emission of sulfur-containing compounds that are toxic to the environment. To remove sulfur, the hydrogen-assisted hydrodesulfurization process is used at the refineries.
5.1 Draw the structure of products A to E of thiophene hydrodesulfurization, knowing that A and B are cyclic regioisomers and C is cyclic.
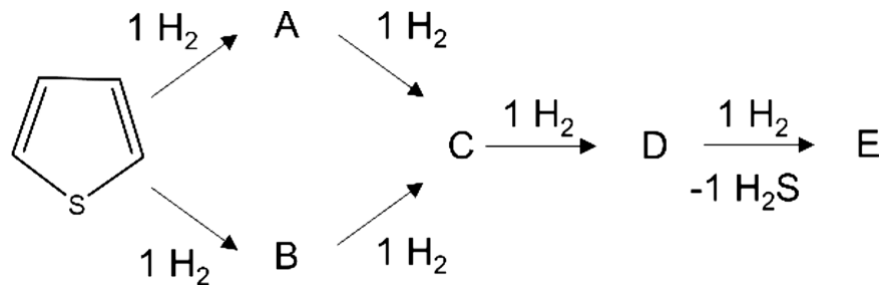
Figure 1. Thiophene hydrodesulfurization process
Sulfur has two most common natural stable isotopes, \(\ce{^{32}S}\) and \(\ce{^{34}S}\), with a relative molar abundance of \(x(\ce{^{32}S})=94.8\,\%\) and \(x(\ce{^{34}S})=4.37\,\%\), respectively. For hydrogen, the stable natural isotopes are \(\ce{^{1}H}\) and \(\ce{^{2}H}\) (\(\ce{D}\)), with a relative molar abundance of \(x(\ce{^{1}H})=99.986\,\%\) and \(x(\ce{^{2}H})=0.014\,\%\), respectively.
5.2 Considering only the isotopes listed above, list all isotopologues of \(\ce{H2S}\).
5.3 Considering only the isotopes listed above, list all isotopologues of \(\ce{H2S}\) containing simultaneously \(\ce{D}\) and \(\ce{^{34}S}\) nuclei and for each calculate the respective relative molar abundance in %.
The desulfurization is a catalytic process typically carried out over \(\ce{MoS2}\) supported on \(\ce{SiO2}\) (\(\ce{MoS2}/\ce{SiO2}\)) catalyst. To study the surface of the catalyst, isotope exchange methods can be employed. The isotope exchange reaction takes place at the gas-solid interface, resulting in the exchange of the surface atoms exclusively. In the first approximation, the bulk atoms do not participate in the exchange (Figure 2).
In the experiment, the isotope exchange between the \(\ce{MoS2}/\ce{SiO2}\) catalyst (Mo mass fraction \(w_{\mathrm{Mo}}=4.280\,\%\), initially containing only \(\ce{^{32}S}\)) and gaseous isotopically-labeled \(\ce{H2^{34}S}\) was studied in a flow reactor (Figure 2). The \(\ce{MoS2}/\ce{SiO2}\) catalyst (\(m_{\mathrm{cat}}=1.2350\,\mathrm{g}\)) was kept in a flow (\(p=1.00\,\mathrm{bar}\), \(v=20.0\,\mathrm{mL\,min^{-1}}\), \(T=23.0\,^\circ\mathrm{C}\)) of gas mixture containing \(\ce{H2^{34}S}\) balanced with \(\ce{Ar}\) (volume fraction \(\varphi(\ce{H2^{34}S})=1.00\,\%\), \(\ce{^{34}S}\) isotopic purity \(\alpha=99.95\ \text{mol.}\,\%\)). The experiment duration was \(t=10.0\,\mathrm{min}\) and gas from the outlet was collected during the entire experiment. The measured fraction of \(\ce{^{34}S}\) isotope among the sulfur atoms (\(\gamma\)) in the collected gas phase was \(\gamma=87.3\ \text{mol.}\,\%\). Assume ideal gas behavior, and that the elemental (not isotopic!) composition of \(\ce{MoS2}\) on the surface and in the bulk are identical, and by the end of the experiment all sulfur atoms from the surface are exchanged with the gas phase.
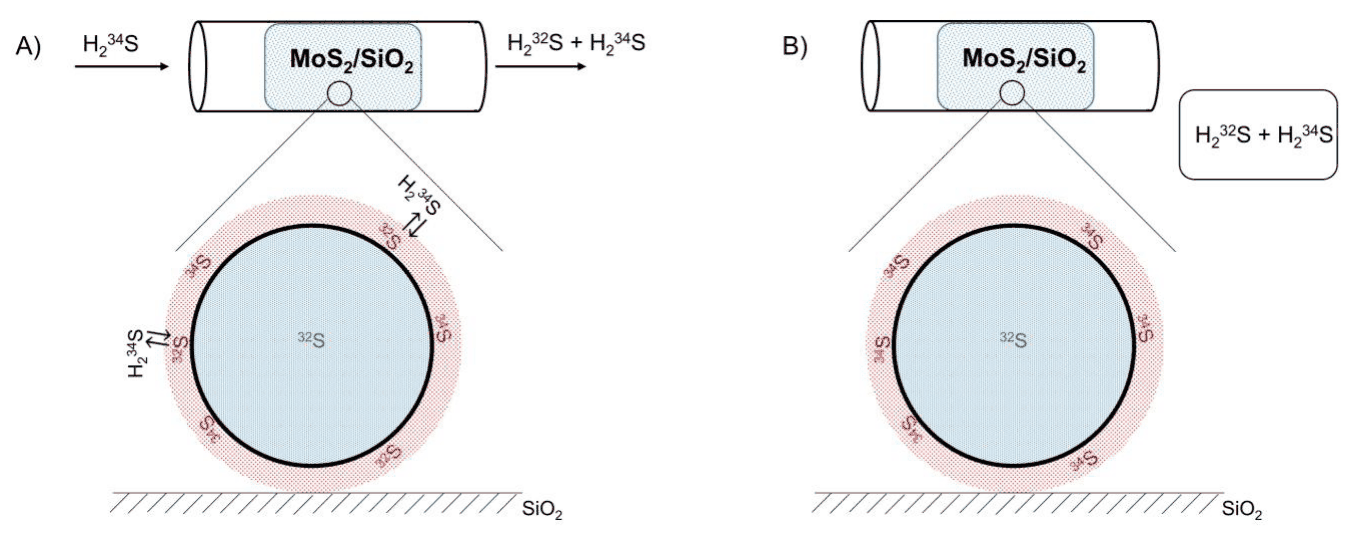
Figure 2. Schematic representation of the experiment in the course (A) and at the final stage (B). Sulfur atoms on the surface are shown in red, sulfur atoms in the bulk are shown in blue. Molybdenum atoms are not shown.
5.4 Calculate the amount of exchanged sulfur atoms \(n(\ce{S})_{\mathrm{surface}}\) in mol.
If you have been unable to calculate the amount of exchanged sulfur atoms, use the value \(1.53\times10^{-5}\,\mathrm{mol}\) in all the following calculations.
Assume that the \(\ce{MoS2}\) phase consists of uniform spherical particles, and at the end of the experiment all sulfur atoms located on the surface are exchanged, while the bulk atoms did not participate in the exchange reaction. The density of \(\ce{MoS2}\) is \(\rho=5.06\,\mathrm{g\,cm^{-3}}\), the average area occupied by \(\ce{S}\) and \(\ce{Mo}\) atoms on the surface is equal to \(A_{\mathrm{S}}=3.00\times10^{-19}\,\mathrm{m^2}\) and \(A_{\mathrm{Mo}}=5.00\times10^{-19}\,\mathrm{m^2}\), respectively. The area of a sphere with radius \(R\) can be calculated as \(S=4\pi R^2\), and its volume as \(V=(4/3)\pi R^3\). Assume that isotopic composition does not affect the density of \(\ce{MoS2}\).
5.5 Calculate the particle radius \(R\) of the \(\ce{MoS2}\) particles. Give your answer in nm.
In reality, the isotopically-labeled atoms from the surface diffuse into the bulk and the non-labeled atoms from the bulk travel to the surface, undergoing a gradual exchange (Figure 3A). Therefore, for a given moment, the fraction of the labeled atoms inside the particle decreases from the surface of the particle to its center. Simultaneously, with an increase in time of exchange, the involvement of bulk atoms to the exchange reaction increases, as sketched in Figure 3B.
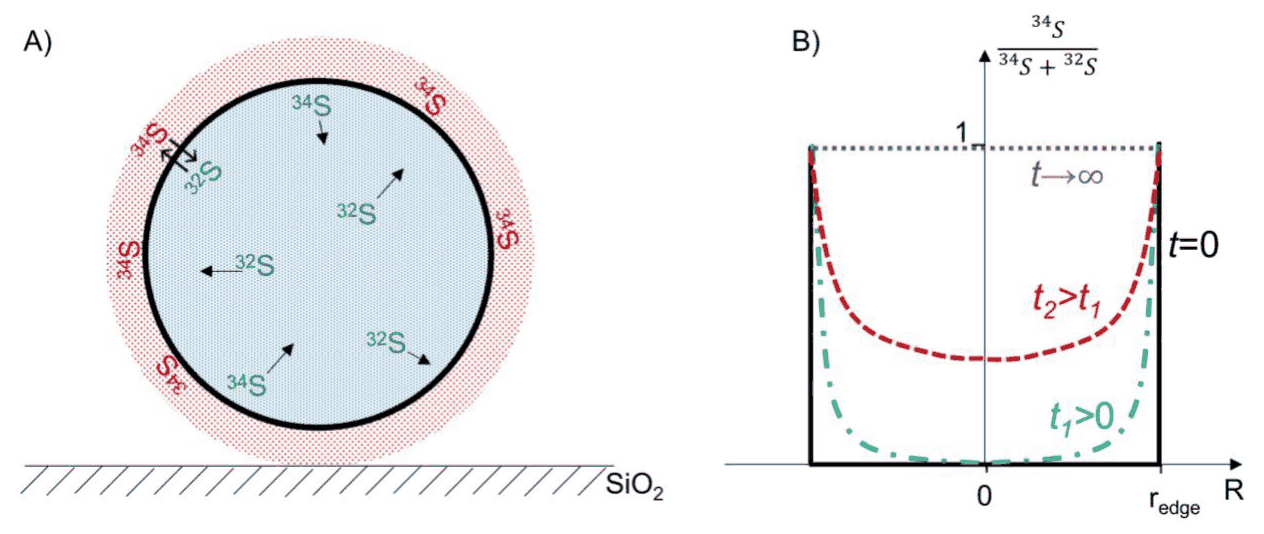
Figure 3. A) Schematic representation of the diffusion of sulfur isotopes from the surface to the bulk in a \(\ce{MoS2}\) particle. Sulfur atoms on the surface are shown in red, sulfur atoms in the bulk are shown in blue. Molybdenum atoms are not shown. B) The fraction of \(\ce{^{34}S}\) atoms in the bulk as function of time and distance from center of the particle; \(r_{\mathrm{edge}}\) corresponds to the radius of \(\ce{MoS2}\) particle.
At the end of the experiment, the surface atoms are completely exchanged, and additionally a fraction of the bulk is exchanged via diffusion. The fraction of the exchanged bulk atoms, \(n(\ce{S})_{\mathrm{bulk}}^{\mathrm{ex}}\), of the total bulk atoms of sulfur, \(n(\ce{S})_{\mathrm{bulk}}^{\mathrm{total}}\), can be calculated as:
\[ F=n(\ce{S})_{\mathrm{bulk}}^{\mathrm{ex}}/ n(\ce{S})_{\mathrm{bulk}}^{\mathrm{total}} =1-\exp(-Dt/R^2) \]
Where \(t\) is the time of exchange experiment (described above), \(R\) is the particle radius, and \(D\) is the diffusion coefficient. The catalyst described above was independently studied by means of electron microscopy, which showed that the \(\ce{MoS2}\) particles are uniformly distributed spheres with a radius of \(35.0\,\mathrm{nm}\).
5.6 Using \(R=35.0\,\mathrm{nm}\) and the data of the exchange experiment described above, calculate the diffusion coefficient \(D\) (in \(\mathrm{m^2\,s^{-1}}\)) for the diffusion of sulfur atoms in \(\ce{MoS2}\). In your calculations, use the approximation \(e^x\approx1+x\) for \(x\ll1\).
Official English text of the problem.
Problem 6: Direct Conversion of Methane to Methanol
Methane is widely available as natural gas making it an attractive feedstock for the chemical industry, such as for the production of methanol. However, control of this process is challenging as methanol is more easily oxidized than methane. Overoxidation is avoided in a chemical looping process, where active sites of copper-exchanged zeolite catalysts provide only the single oxygen atom required for oxidation to methanol and are consumed. In a second step, the catalyst is regenerated with oxygen in the absence of methane. The scheme below shows two potential catalytic copper sites. During the reaction, Cu(II) is reduced to Cu(I).
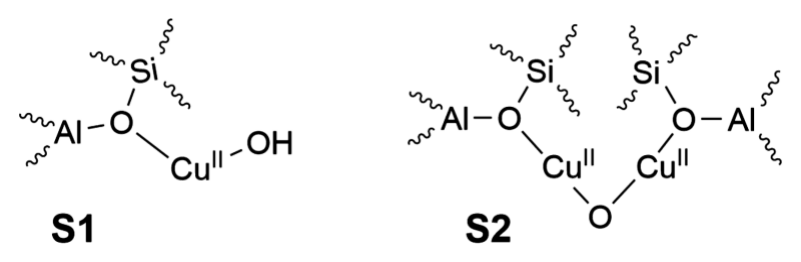
6.1 Give the number of S1 sites and the number of S2 sites required to oxidize one methane molecule to methanol.
In the absence of oxygen, the methanol formed does not desorb from zeolite. If the reaction is performed in a container with constant volume and temperature (an autoclave), a pressure-drop results only from the consumption of methane, which can be considered as an ideal gas. In a 1 L autoclave containing 200 mg of zeolite loaded with 4.3 % wt. copper, the initial methane pressure \(p_0 = 933\ \mathrm{Pa}\) dropped to \(p_\infty = 925\ \mathrm{Pa}\) after completion of the reaction at 528 K.
6.2 Calculate the percentage of copper that reacted.
6.3 Experimental data are plotted in Figure 1. Based on this, decide on the (pseudo) order of the oxidation of \(\ce{CH4}\).
(a) The reaction is of (pseudo) zeroth order.
(b) The reaction is of (pseudo) first order.
(c) The reaction is of (pseudo) second order.
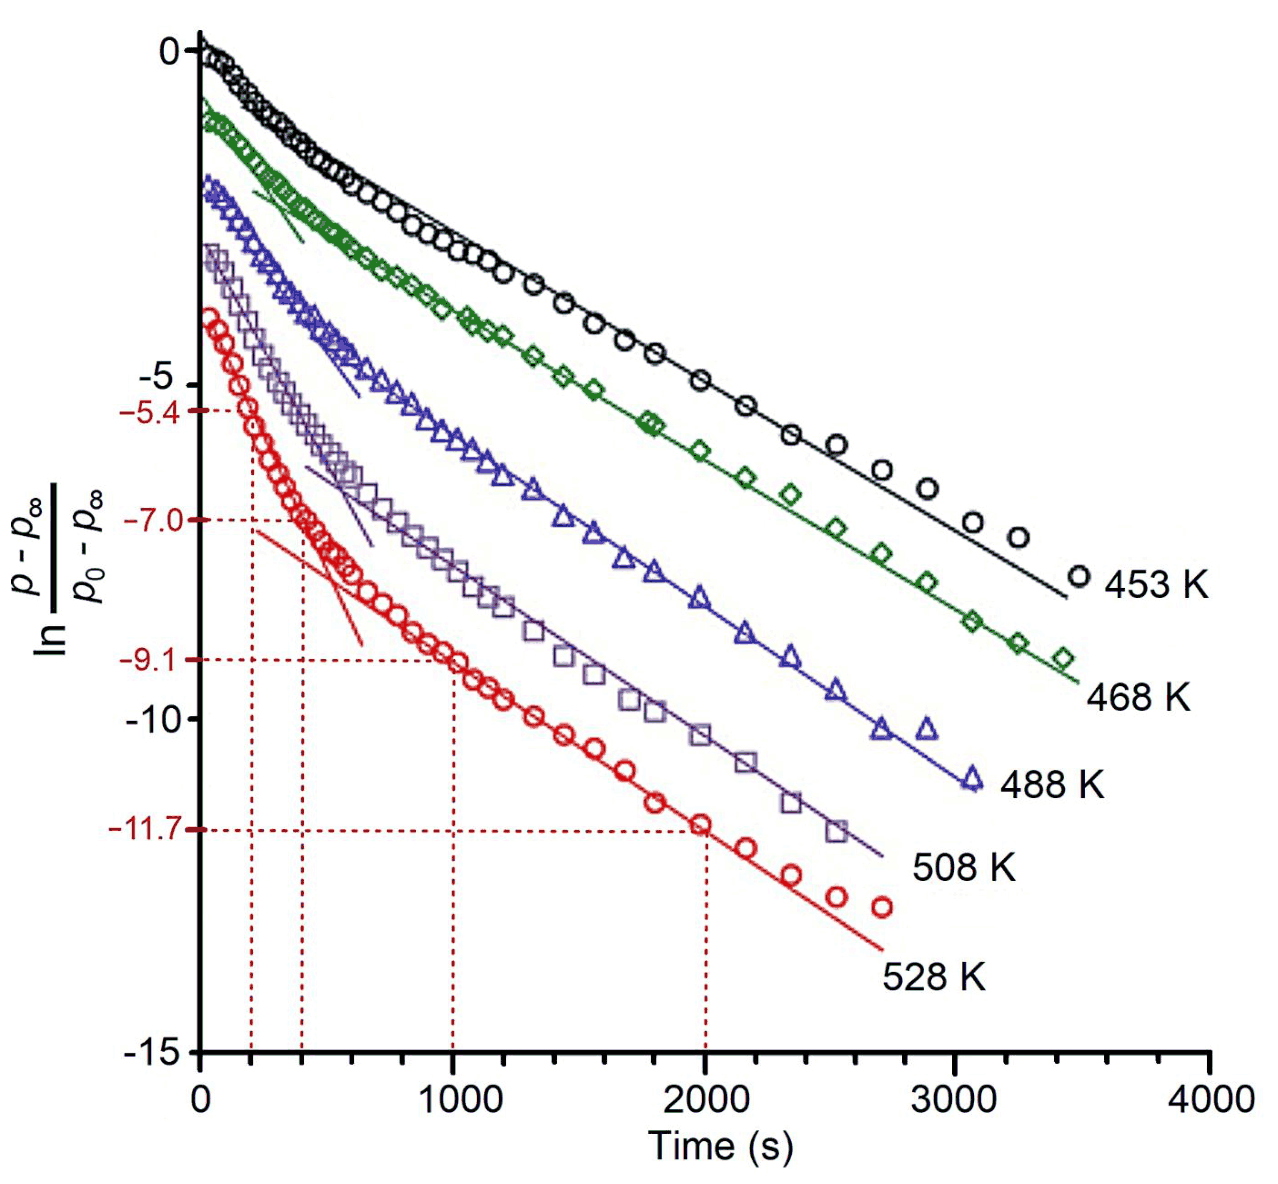
Figure 1. Semi-logarithmic graph of normalized methane pressure versus time for the reaction with copper-loaded zeolite containing sites S1 and S2 in an autoclave at various temperatures. The symbols denote experimental data points. The solid lines are linear fits to appropriate time ranges. The dotted lines are guides for the eyes
6.4 Write down the (pseudo) rate law for the oxidation of \(\ce{CH4}\) that is consistent with the experimental data under the given conditions. Note that it may depend on the concentrations of \(\ce{CH4}\) as well as of sites S1 and S2 and on the rate constants.
6.5 Choose the correct statement(s).
(a) At least two types of copper sites react, each with a different rate constant.
(b) The overall methane oxidation by zeolite is faster at higher temperature.
(c) At higher temperature, a larger fraction of the copper sites will have reacted with methane after completion of the reaction.
(d) One of the reactions becomes slower at higher temperature.
Paramagnetic sites S1 can be observed by electron paramagnetic resonance (EPR) spectroscopy, whereas diamagnetic sites S2 do not give an EPR signal. EPR spectroscopy measures the number of electron spins. Thus, the number of S1 sites is proportional to the double integral \(I_2\) of the EPR spectrum, i.e. \([\mathbf{S1}] \propto I_2\). Spectra were measured at different temperatures \(T\) and at each temperature at different times, \(t\), after initiating the reaction.
6.6 Derive the equation, which is linear in time, that relates \(I_2(t)\) to the rate constant for the loss of S1 sites.
6.7 Tick the boxes on the answer sheet for each measurement that needs to be calibrated with a known Cu(II) standard.
(a) Total number of paramagnetic Cu(II) sites in the sample.
(b) Concentration of paramagnetic Cu(II) sites in the sample.
(c) Rate constant.
(d) Types of different paramagnetic Cu(II) species in the sample.
From EPR measurements, it is known that the rate constant for the reaction with S1 sites at 528 K is \(2.604 \times 10^{-3}\ \mathrm{s^{-1}}\).
6.8 Considering Figure 1 and based on a calculation, decide if methane reacts faster or slower with S2 sites than with S1 sites.
(a) Methane reacts faster with S1.
(b) Both reaction rates are the same.
(c) Methane reacts faster with S2.
Methanol can be further converted into valuable olefins with different zeolite catalysts. In this process, one observes an intermediate product with molar mass \(86.09\ \mathrm{g\,mol^{-1}}\), elemental analysis (55.8 % wt. \(\ce{C}\), 7.0 % wt. \(\ce{H}\)) and an \({}^{1}\mathrm{H}\) NMR spectrum consisting of signals at four different chemical shifts:
a: 12.2 ppm (1H, s), broad, disappears when \(\ce{D2O}\) is added
b: 6.3 ppm (1H, d)
c: 5.7 ppm (1H, d)
d: 2.0 ppm (3H, s)
6.9 Draw the structure of the intermediate product and assign protons a and d.
The United States Department of Energy assigned twelve chemical compounds only containing \(\ce{C}\), \(\ce{H}\) and \(\ce{O}\) as platform chemicals. These are the most promising candidates, easy to prepare from renewable resources and with multiple target derivatives to be prepared from them. One of them is compound A, that can either be further derivatized or used for example in medicinal applications or in detergents.
- \({}^{1}\mathrm{H}\) NMR in DMSO: 7.81 ppm (a, s), 13.0 ppm (b, s, broad, disappears when \(\ce{D2O}\) is added), both signals have the same integral.
- \({}^{13}\mathrm{C}\) NMR: 165.1 ppm (1), 150.6 ppm (2) and 120.6 ppm (3).
- \(M = 156.03\ \mathrm{g\,mol^{-1}}\). Elemental analysis: 46.15 % wt. \(\ce{C}\), 2.56 % wt. \(\ce{H}\).
6.10 Give a possible structure of A and assign all protons and carbon 1.
Official English text of the problem.
Problem 7: Enzyme Kinetics
The Michaelis–Menten (MM) mechanism, introduced in 1913, describes the kinetics of enzyme catalysis. In this mechanism, enzyme \(\ce{E}\) catalyzes the conversion of substrate \(\ce{S}\) to the product \(\ce{P}\):
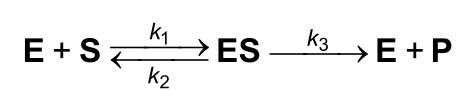
The initial rate for an enzymatic reaction following the MM mechanism is given as
\[ v_0=v_{\max}\frac{[\ce{S}]_0}{K_{\mathrm M}+[\ce{S}]_0} \tag{1} \]
when the initial concentration of \(\ce{E}\) is much lower than the initial concentration of \(\ce{S}\), \([\ce{E}]_0\ll[\ce{S}]_0\). The Michaelis constant is defined as \(K_{\mathrm M}=(k_2+k_3)/k_1\). The initial rate can also be expressed as the product of the relative flow \(j\) and \([\ce{E}]_0\):
\[ v_0=j[\ce{E}]_0 \tag{2} \]
Note: Questions 7.1 and 7.2 can have one, multiple, or no correct answer(s).
7.1 Choose the correct alternative form(s) of the initial rate (\(v_0\)) expressions (1) and (2).
\([\ce{ES}]_{\max}\) is the maximum concentration of the \(\ce{ES}\) complex.
- (a) \(\displaystyle v_0=\frac{k_3[\ce{E}]_0[\ce{S}]_0}{K_{\mathrm M}+[\ce{S}]_0}\)
- (b) \(\displaystyle v_0=\frac{k_3[\ce{E}]}{K_{\mathrm M}/[\ce{S}]_0+1}\)
- (c) \(\displaystyle v_0=j[\ce{ES}]_{\max}\)
- (d) \(\displaystyle v_0=\frac{k_3[\ce{E}]_0[\ce{ES}]_{\max}}{K_{\mathrm M}+[\ce{S}]_0}\)
- (e) \(\displaystyle v_0=\frac{k_3[\ce{E}]_0}{K_{\mathrm M}/[\ce{S}]_0+1}\)
- (f) \(\displaystyle v_0=\frac{j[\ce{E}]_0}{K_{\mathrm M}+[\ce{S}]_0}\)
7.2 Choose the pair(s) of axes (\(y\) vs. \(x\)) that are expected to give a linear plot.
- (a) \(v_0\) vs. \(1/[\ce{S}]_0\)
- (b) \(v_0\) vs. \(v_0/K_{\mathrm M}\)
- (c) \(v_0\) vs. \(K_{\mathrm M}/v_0\)
- (d) \(1/v_0\) vs. \(v_0/[\ce{S}]_0\)
- (e) \(1/v_0\) vs. \(v_0/K_{\mathrm M}\)
- (f) \([\ce{S}]_0/v_0\) vs. \([\ce{S}]_0\)
Many enzymes catalyze multi- rather than single-substrate transformations. However, if the concentration of one of the substrates is much higher than that of the other substrate or it is kept constant, the MM kinetics is also valid. Here we will look at two independent enzymatic systems that follow the MM kinetics.
Enzymatic System I
Enzyme \(\ce{E}\) converts substrates \(\ce{A}\) and \(\ce{B}\) to products \(\ce{P_A}\) and \(\ce{P_B}\). At rapid pre-equilibrium between the free enzyme and all enzyme–substrate complexes, the following equation applies:
\[ v_0= \frac{k[\ce{E}]_0[\ce{A}]_0[\ce{B}]_0} {(K+[\ce{A}]_0)(K+[\ce{B}]_0)} \tag{3} \]
where \(k\) is the rate constant of one of the reactions. The same equilibrium constant \(K\) characterizes the dissociation of either substrate from the corresponding active site of \(\ce{E}\).
7.3 Show that equation (3) takes the MM form (1) if the concentration of substrate \(\ce{B}\) is maintained at a constant value \(c_0\). Give the expression for \(v_{\max}\) in this case.
7.4 Propose a kinetic scheme for the Enzymatic System I consistent with eq. (3), showing all the intermediates and products. Indicate the reaction with a rate constant \(k\).
Enzymatic System II
Enzyme \(\ce{E}\) has five active sites, each of which is specific to one of the substrates \(\ce{S_A}\), \(\ce{S_B}\), or \(\ce{S_C}\) that are selectively transformed to products \(\ce{P_A}\), \(\ce{P_B}\), or \(\ce{P_C}\), respectively. There is at least one active site for each substrate. Each active site is independent of the others.
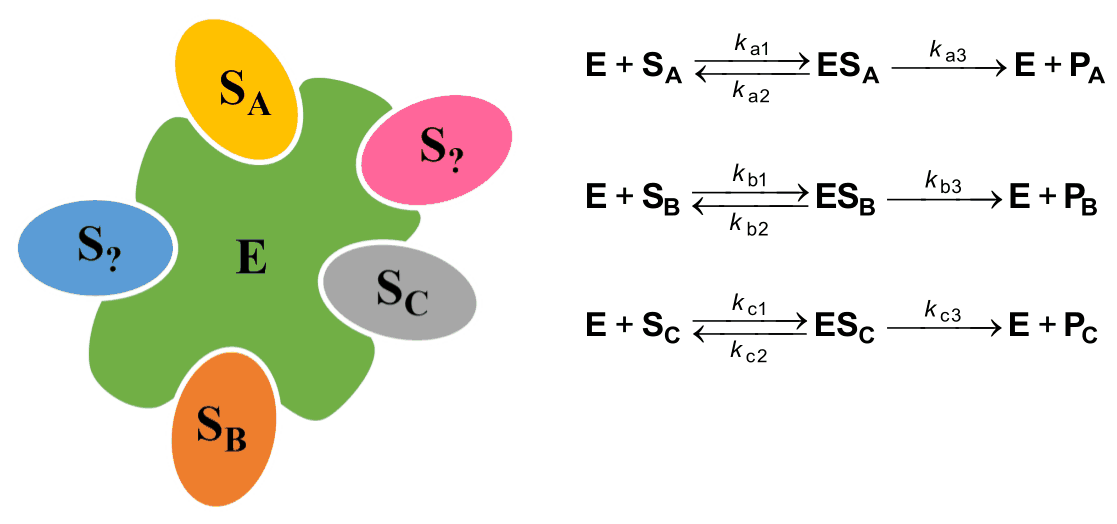
For \(\ce{E}\), it is known that:
-
The affinity for \(\ce{S_C}\) is higher than for \(\ce{S_B}\).
-
The plot of \(v_{0i}\) vs. \(v_{0i}/[\ce{S_i}]_0\), known as Eadie–Hofstee plot, for \(\ce{S_A}\), \(\ce{S_B}\), \(\ce{S_C}\), with rate given per active site (\(v_{0i}\)), is shown below, but the scale and the legend are omitted.
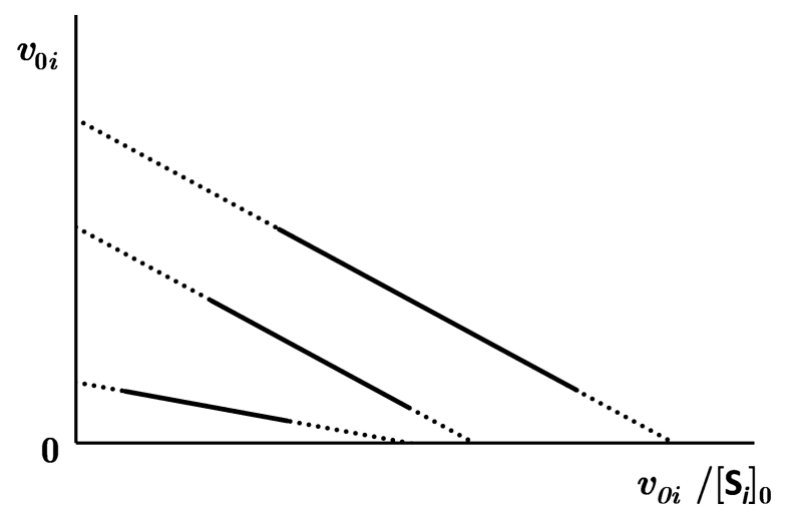
-
When \(\ce{E}\) is saturated with \(\ce{S_A}\), \(\ce{S_B}\), \(\ce{S_C}\), the catalytic turnover number (TON) for \(\ce{S_C}\) per site is \(10200\ \mathrm{min^{-1}}\), and 2023 product \(\ce{P_A}\), \(\ce{P_B}\), \(\ce{P_C}\) molecules in total are synthesized per second. At the same time, no more than \(5.94\times10^6\) molecules of \(\ce{P_A}\) and \(\ce{P_B}\) are detected to form per hour.
-
At equimolar concentrations of \(\ce{S_A}\), \(\ce{S_B}\), \(\ce{S_C}\), which are at least 1000-times lower than corresponding \(K_{\mathrm M,i}\) values, the \(\ce{P_A}\), \(\ce{P_B}\), \(\ce{P_C}\) concentrations become proportional to the catalytic efficiency \((\varepsilon_i=k_{i3}/K_{\mathrm M,i})\), and their ratio is \(3:2:5\), respectively.
-
Two \(\ce{ES_i}\) complexes have equal rate constants for dissociation to \(\ce{E}\) and \(\ce{S_i}\). The activation barrier for the reaction of \(\ce{ES_C}\) into the initial compounds is \(1266\ \mathrm{J\,mol^{-1}}\) higher than for the reaction into the final products. Assume that the pre-exponential factors are equal for both reactions and \(T=25\,^\circ\mathrm C\).
-
For \(\ce{E + S_i}\) reaction: \(k_{\mathrm{c1}}=1.57\times10^7\ \mathrm{M^{-1}\,s^{-1}}\) and \(k_{\mathrm{a1}}=k_{\mathrm{b1}}\).
7.5 Fill in the table below and provide your calculations. Hints:
- Use information from points 1 and 2 to find the relation (\(<\), \(>\), \(=\)) between constants \(K_{\mathrm M,A}\), \(K_{\mathrm M,B}\) and \(K_{\mathrm M,C}\).
- Information from points 3 and 5 allows you to complete the first column (number of active sites for each substrate) and the last row (all the constants for substrate \(\ce{S_C}\)) of the table. Check that the sum of active sites is equal to 5.
# of active sites \(k_1\) \(k_2\) \(k_3\) \(K_{\mathrm M}\) \(\ce{S_A}\) \(\ce{S_B}\) \(\ce{S_C}\) \(1.57\times10^7\ \mathrm{M^{-1}\,s^{-1}}\) Official English text of the problem.
Problem 8: Nazarov Reaction
The Nazarov reaction is a frequently used reaction of divinyl ketones to give cyclopentenones. It proceeds either photochemically or via acid catalysis and is an electrocyclization, followed by a proton transfer.

8.1 Draw the π molecular orbitals to describe the Nazarov reaction. Fill in the electrons into the respective energy levels. Mark with an x the (i) HOMO (highest occupied molecular orbital) and (ii) LUMO (lowest unoccupied molecular orbital). For this exercise, you can consider the divinyl ketone as a pentadienyl cation with five p-orbitals.
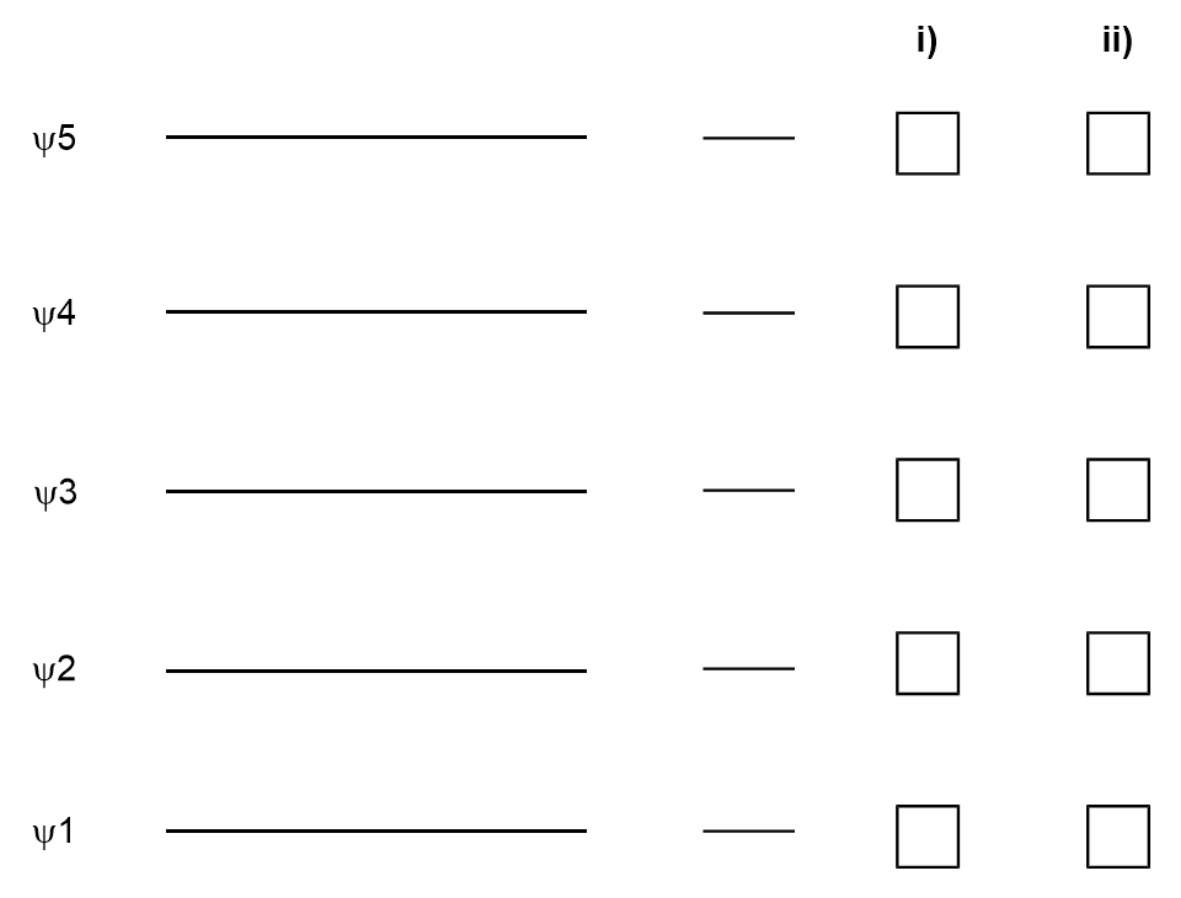
8.2 From the π molecular orbitals you derived in Task 8.1, predict under which conditions the Nazarov reaction of the divinyl ketone will proceed in a disrotatory or conrotatory fashion. In the table mark with an x the conditions under which the reaction is allowed.
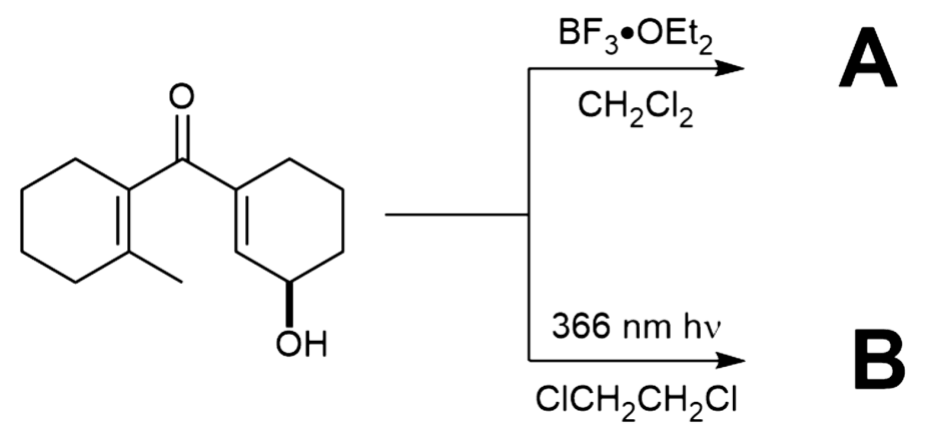
Disrotatory Conrotatory Thermal Photochemical 8.3 The Nazarov reaction was used as key reaction in a synthesis of Farnesin. For both conditions below, draw one possible structure for each of A and B, including stereochemistry. Note that the products of both reactions show \(\ce{^1H}\) NMR a signal at 6.70–6.73 ppm.
The synthesis of Capnellene commences with unsaturated aldehyde C shown below. Treatment with D, followed by reaction with \(\ce{MnO2}\) supported on carbon gave divinyl ketone E shown below. Exposure to a mixture of \(\ce{P2O5}\) and MsOH yielded F, which was elaborated via a sequence of reactions to the unsaturated ketone I.
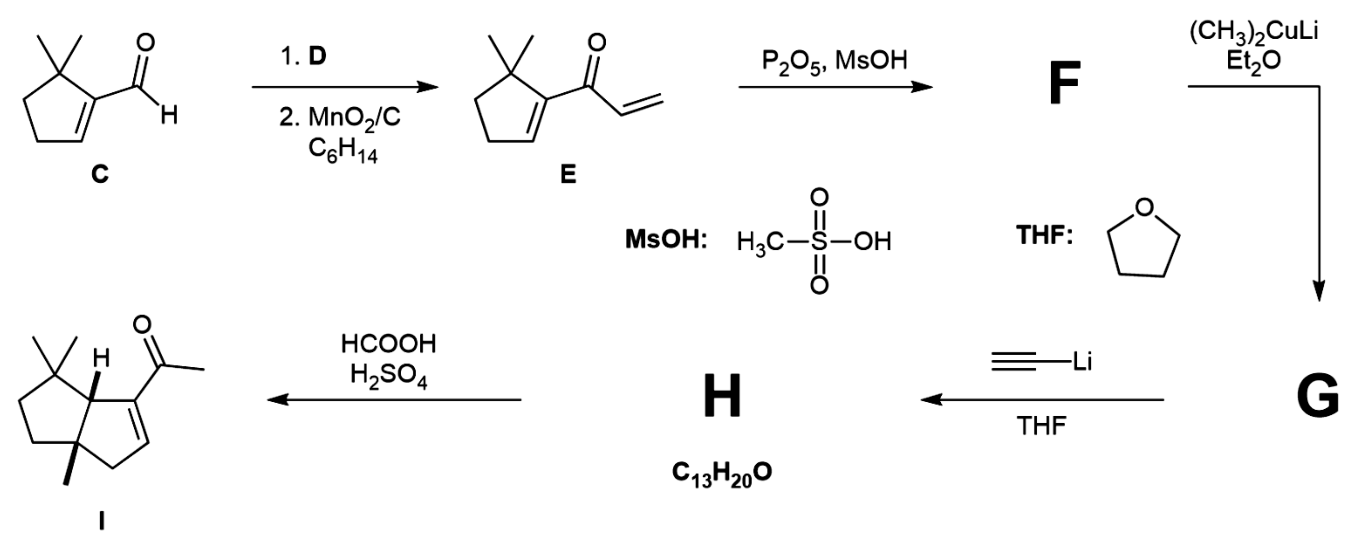
8.4 Choose the reagent(s) from the list that would be suitable as D.
(a) \(\ce{H2C=CHMgBr}\) (c) \(\ce{H2C=CHBr}\), \(\ce{Pd(PPh3)4}\)
(b) 1. \(\ce{NaBH4}\) 2. \(\ce{H2C=CHLi}\) (d) \(\ce{H2C=CHMgBr}\), \(\ce{CuI}\)
8.5 Give the structures of intermediates F, G, and H, including their stereochemistry.
Enone I was then subjected to \(\ce{H2C=CHMgBr}\) and \(\ce{CuI}\) in THF to give intermediate J, followed by ozonolysis to yield intermediate K, which shows a signal at 9.61 ppm in the \(\ce{^1H}\) NMR. Treatment with 5-% \(\ce{KOH}\) in a mixture of THF and ether yielded intermediate L. Hydrogenation with a Pt catalyst and under an atmosphere of \(\ce{H2}\) yielded M, which finally gave rise to Capnellene.
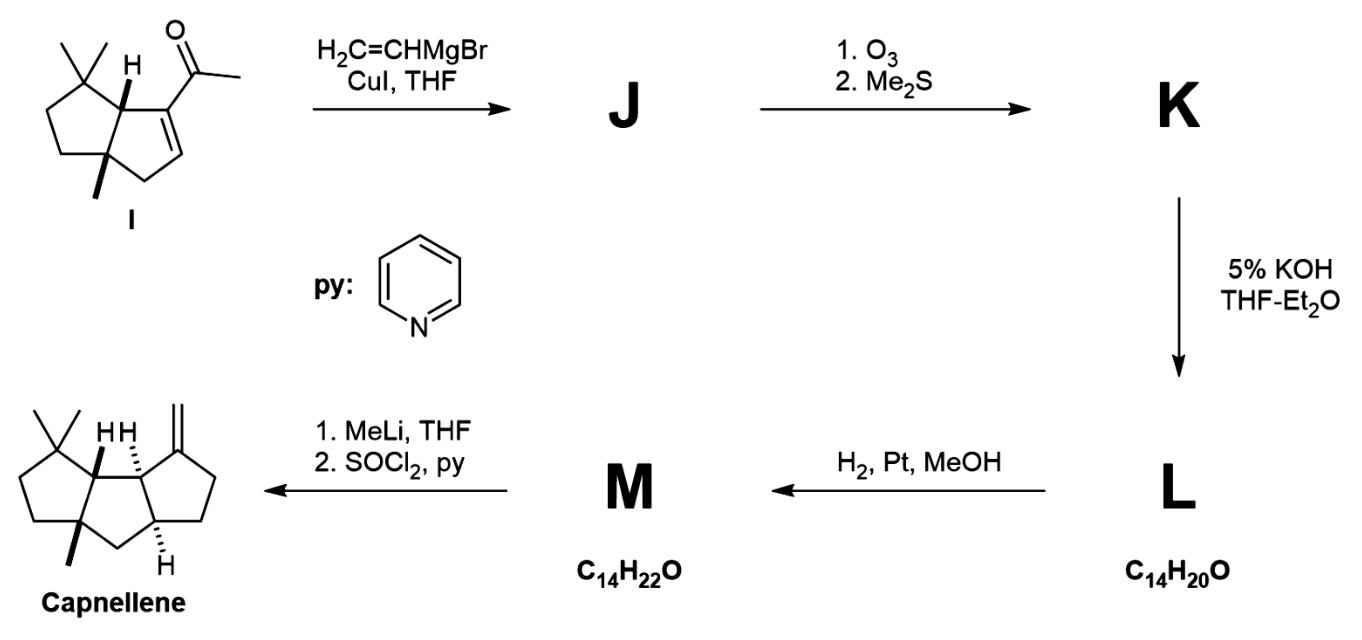
8.6 Give the structures J, K, L, and M, including their stereochemistry.
Official English text of the problem.
Problem 9: Electrolysis in Organic Synthesis
The Kolbe electrolysis describes the decarboxylative dimerization of two carboxylic acids and only proceeds if the acid is deprotonated. The unbalanced equation is shown here.
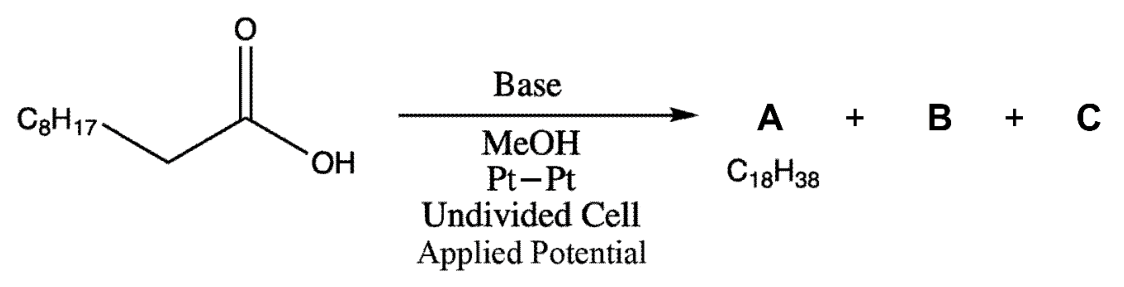
Two gases (B and C) are produced during the reaction. B reacts with \(\ce{Ca(OH)2}\), while C is highly flammable.
9.1 Provide the structural formulae of A, B, and C.
9.2 The synthesis is formally a redox reaction, where the carboxylate is oxidized and the solvent is reduced. Formulate the oxidative and reductive half reactions and the overall redox reaction.
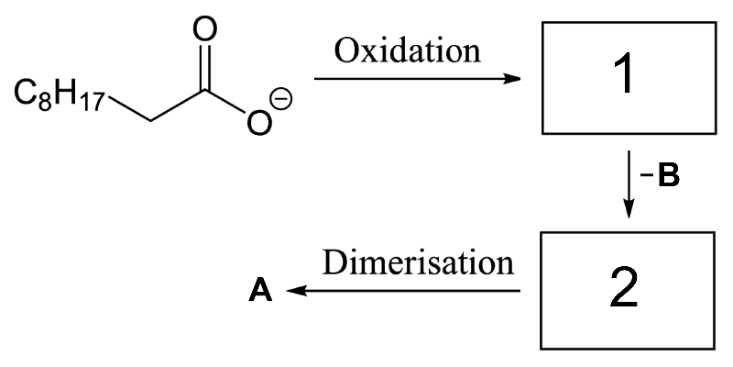
9.3 Provide the intermediates 1 and 2 in the mechanism for the oxidative decarboxylation and formation of the product.
The Kolbe electrolysis is usually only efficient for long-chained saturated carboxylic acids and not for certain carboxylic acids, such as D. Here, the overoxidation of the radical intermediate E to a positively charged species F is facilitated. Intermediate F can react with nucleophiles to form different side products, for example it reacts with D to form an ester G, and with \(\ce{MeOH}\) to form H.
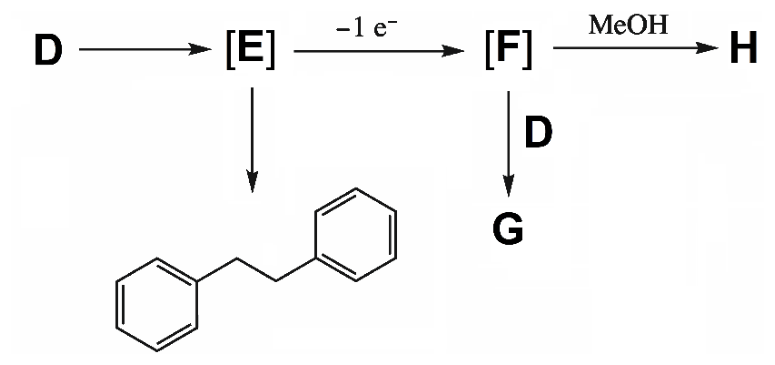
9.4 Provide the structures of D–H.
The electrolysis of carboxylic acid I in the presence of an excess of co-acid J yields two main products (by \({}^{1}\mathrm{H}\) NMR analysis) that are inseparable by silica gel chromatography. Their spectroscopic data are almost identical. In the \({}^{1}\mathrm{H}\) NMR, the two species are only distinguishable by two signals with small differences in chemical shifts.
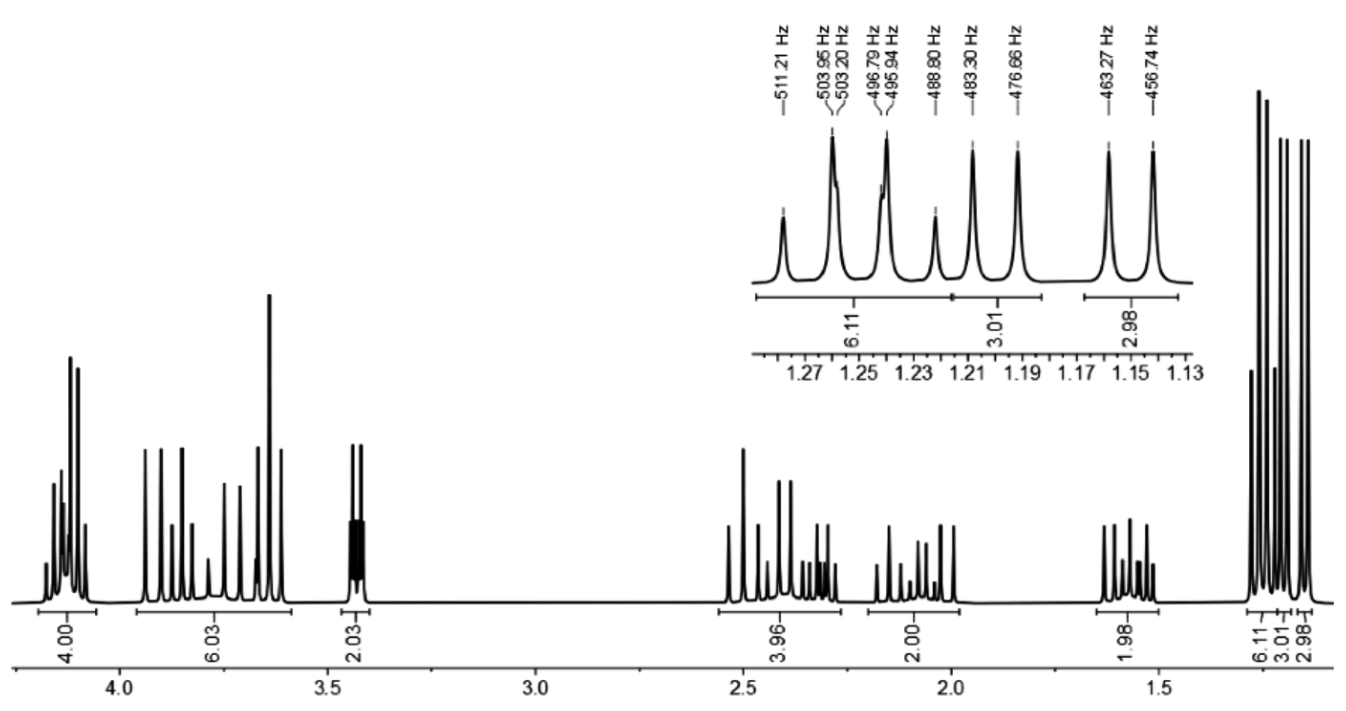
The \({}^{1}\mathrm{H}\) NMR spectrum looks as follows (1:1 mixture of products K and L):
4.18–4.08 (m, 4 H), 3.95–3.60 (m, 6 H), 3.43 (dt, 2 H, \(J=7.8,\ 2.2\ \mathrm{Hz}\)),
2.55–2.25 (m, 4 H), 2.20–1.95 (m, 2 H), 1.65–1.50 (m, 2 H)Specific signals for K:
1.26 (t, 3 H, \(J=7.2\ \mathrm{Hz}\)), 1.20 (d, 3 H, \(J=6.6\ \mathrm{Hz}\))
Specific signals for L:
1.24 (t, 3 H, \(J=7.2\ \mathrm{Hz}\)), 1.15 (d, 3 H, \(J=6.6\ \mathrm{Hz}\))
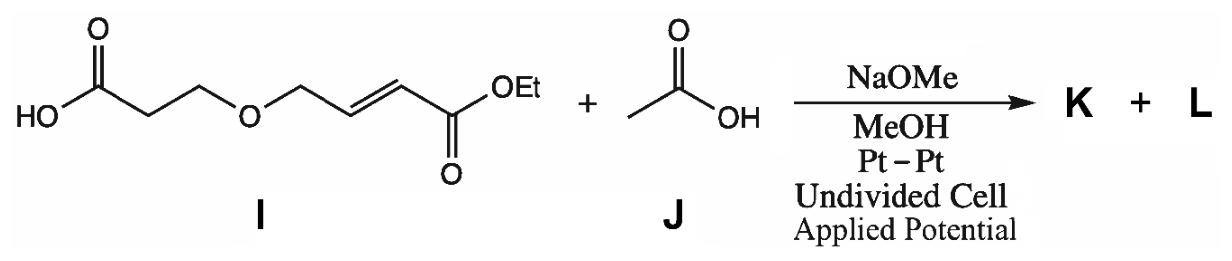
9.5 Provide the structures for products K and L. Indicate how the products are related.
(a) Epimers (b) Enantiomers
(c) Diastereomers (d) Constitutional Isomers
The choice of the electrode material can influence the selectivity of an organic electrosynthetic reaction. The reductive electrolysis of benzaldehyde (M) (16 mM in 1 M aqueous \(\ce{KOH}\), \(\ce{Pt}\) anode, −1.3 V vs. \(\ce{Ag/AgCl}\)) yields different products depending on the cathode material used. Strong binding to the surface favors intermolecular reactions. The figure below shows the product distribution for different cathode materials and the mass spectra of the products.
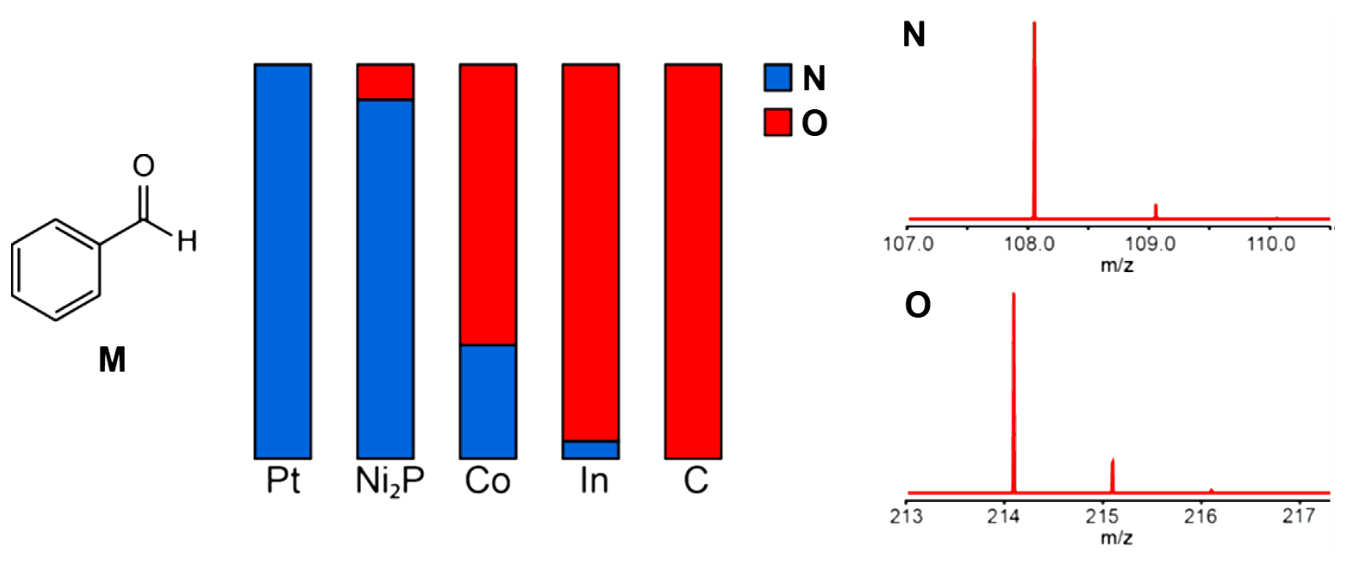
9.6 Provide the structure of N and O.
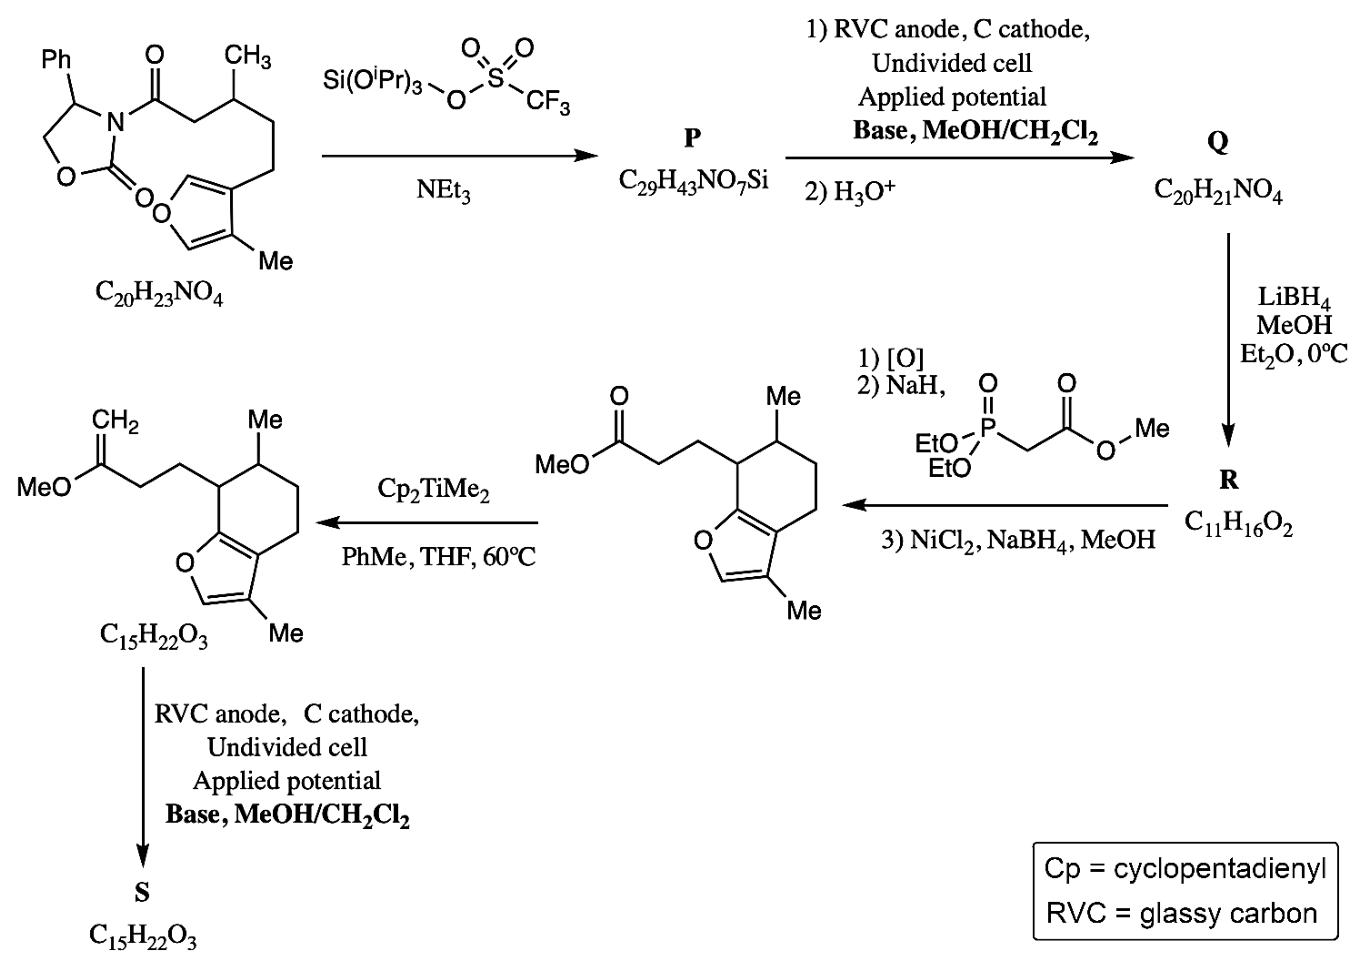
Alkenes, such as enol ethers, can be oxidatively coupled. This typically involves the anodic oxidation of the alkene fragment to yield a radical cation which can be intercepted by a nucleophile.
9.7 Provide the structural formulae of P, Q, R, and S in the scheme below. Indicating stereochemistry is not required. Hint: S is a tricyclic product.
Official English text of the problem.
Problem 10: Switzerland — The Country of Pharmaceuticals
Pasireotide (1) is a peptide-based drug developed by the Swiss pharmaceutical company Novartis to treat the Cushing's disease.
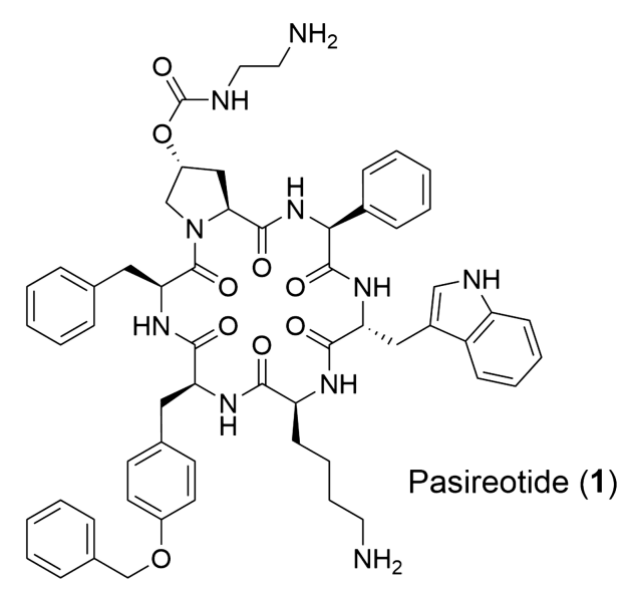
10.1 Determine the number of stereogenic centers (\(n\)) in Pasireotide (1). Calculate the total number of all possible stereoisomers (\(t\)).
Pasireotide (1) is a cyclic peptide. An advanced intermediate in its synthesis (linear peptide 2) can be prepared by solid-phase peptide synthesis (SPPS) using the Fmoc/tBu strategy as shown in Scheme 1.
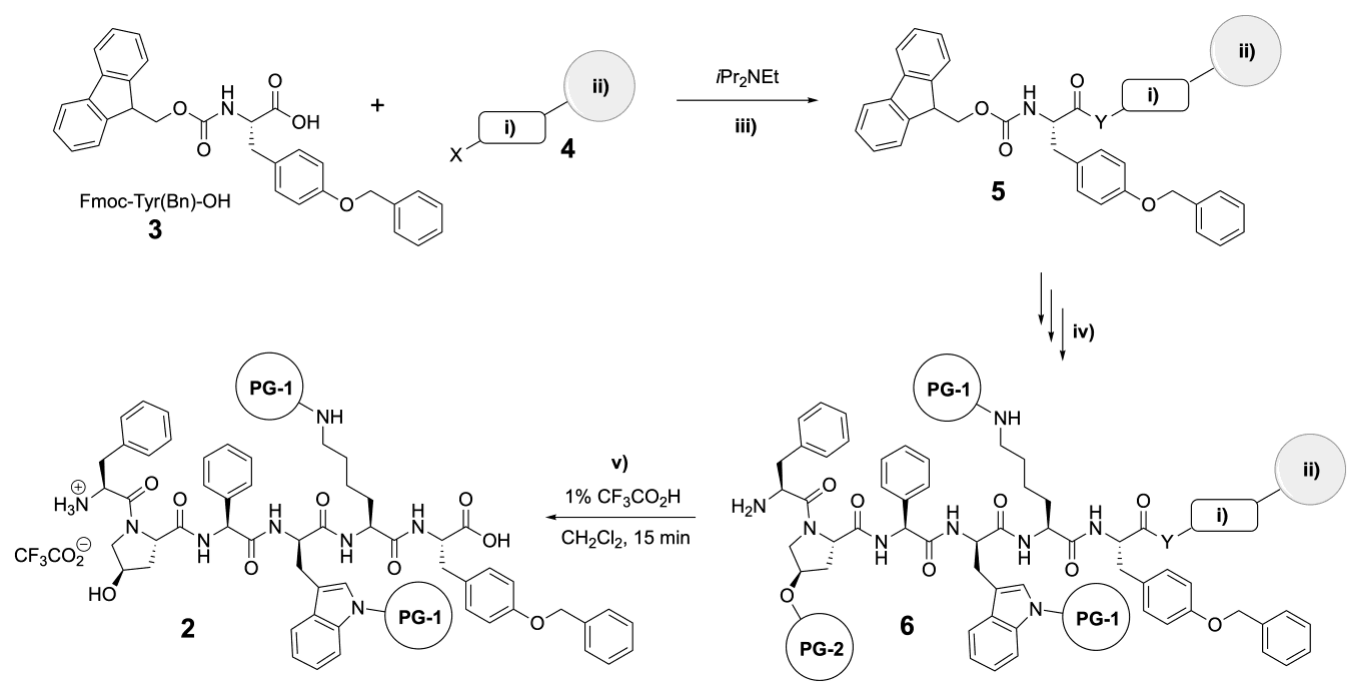
Scheme 1. SPPS of peptide 2. i) Linker; ii) Resin; iii) Resin loading; iv) SPPS: repetition of 1. Fmoc deprotection 2. amino acid coupling + final Fmoc deprotection; v) Peptide cleavage from resin and deprotection of PG-2.
The synthesis starts with the preparation of Fmoc-Tyr(Bn)-OH (3) from Boc-Tyr-OH (7).
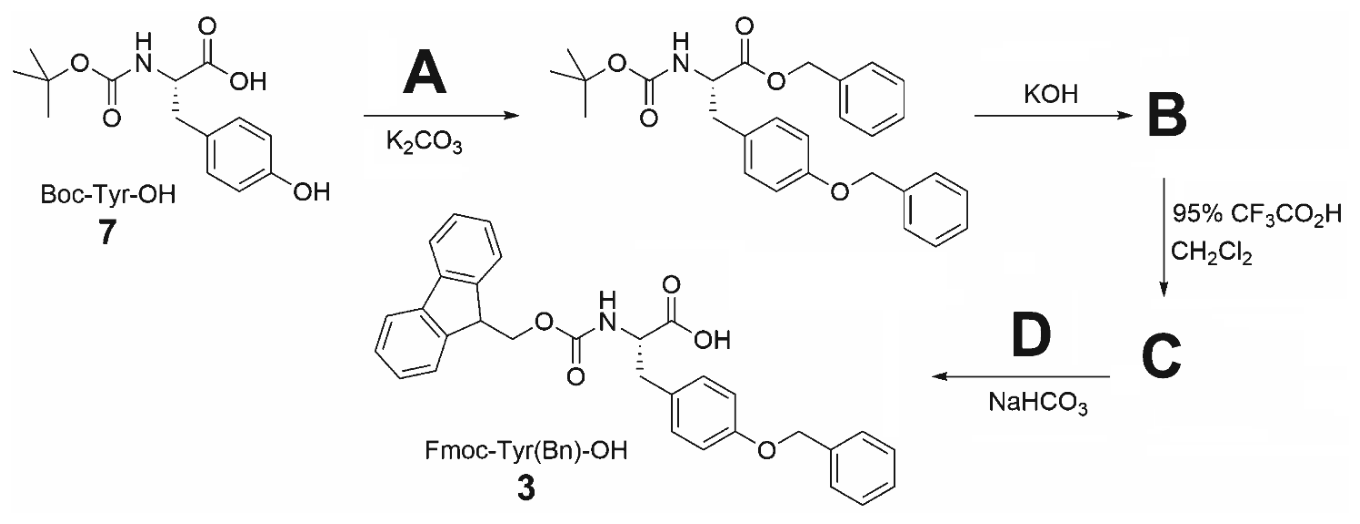
10.2 Draw reagents A and D and intermediates B and C in the synthesis of Fmoc-Tyr(Bn)-OH (3) as shown above.
The SPPS of intermediate 2 begins with attaching the Fmoc-Tyr(Bn)-OH (3) to a suitable resin-bound linker.
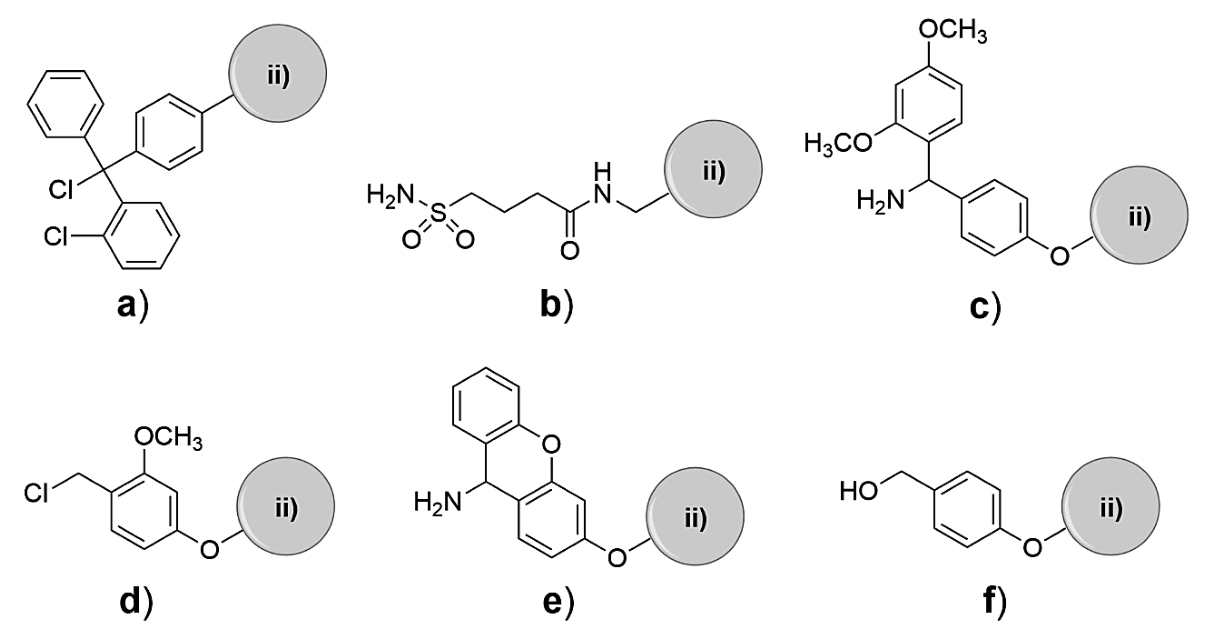
Scheme 2. ii) Resin; a) 2-Chlorotrityl-chloride linker; b) Safety-catch linker; c) Rink amide linker; d) SASRIN-chloride linker; e) Sieber amide linker; f) Wang linker
10.3 Choose the linker(s) 4 from Scheme 2 that are appropriate for SPPS of peptide 2 according to Scheme 1.
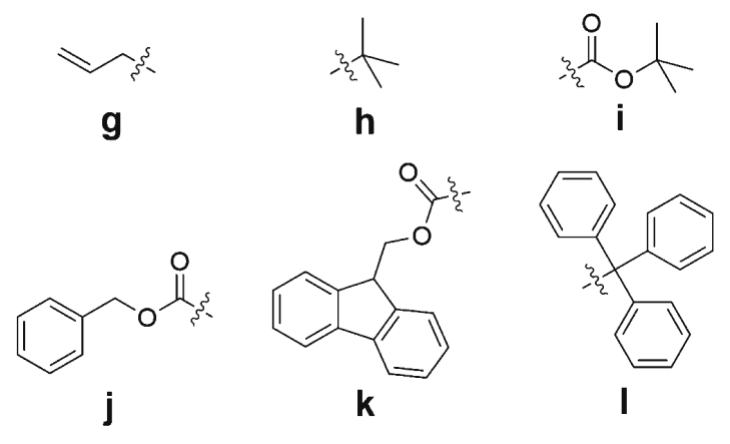
10.4 From g–l choose the most suitable side-chain protecting groups PG-1 and PG-2 for SPPS of 2 according to Scheme 1 that can be orthogonally cleaved in the presence of all other functional groups present in Pasireotide. Only one answer is correct for each of the protecting groups.
Next, linear peptide 2 undergoes an intramolecular coupling reaction to form cyclic peptide 8 according to the following scheme:
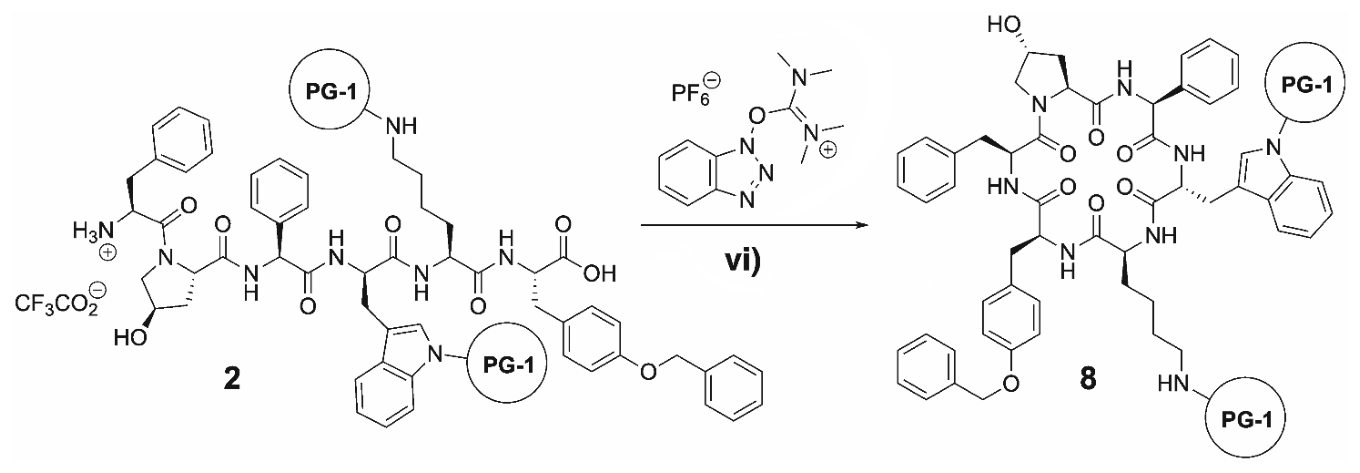
Scheme 3. vi) Base
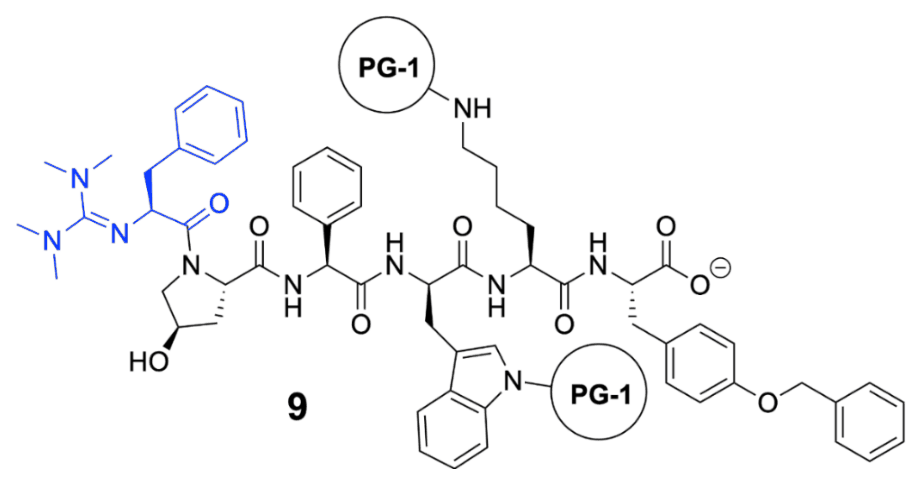
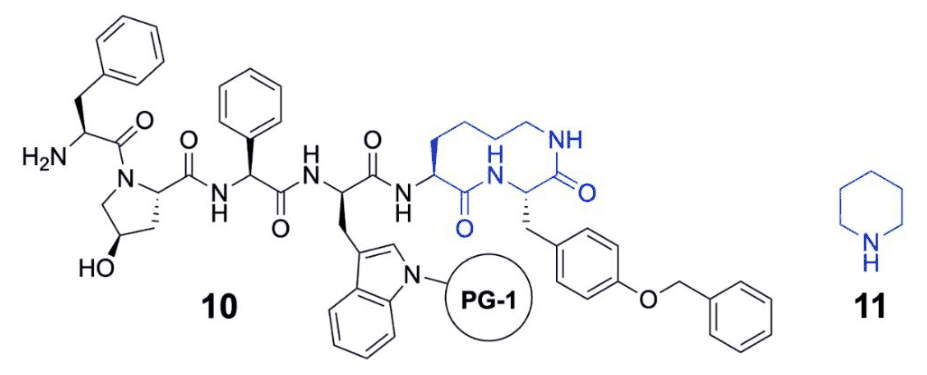
10.5 Choose the correct statement(s) about the cyclization of peptide 2 to 8.
(a) A possible side-product of the reaction is tetramethylguanidylation of the \(N\)-terminal phenylalanine residue resulting in compound 9 shown below.
(b) A possible side-product of the reaction is the cleavage of protecting group PG-1 and cyclization via the amino group of the lysine residue to give compound 10 shown below.
(c) The reaction must be carried out at a high peptide concentration to achieve a sufficient reaction rate.
(d) The reaction must be carried out at a low peptide concentration to prevent polycondensation.
(e) Piperidine (11) below is a suitable base for the reaction.
The last steps of the synthesis involve functionalization of the OH-group of the 4-hydroxyproline residue in 8, followed by cleavage of all PGs to give Pasireotide (1).
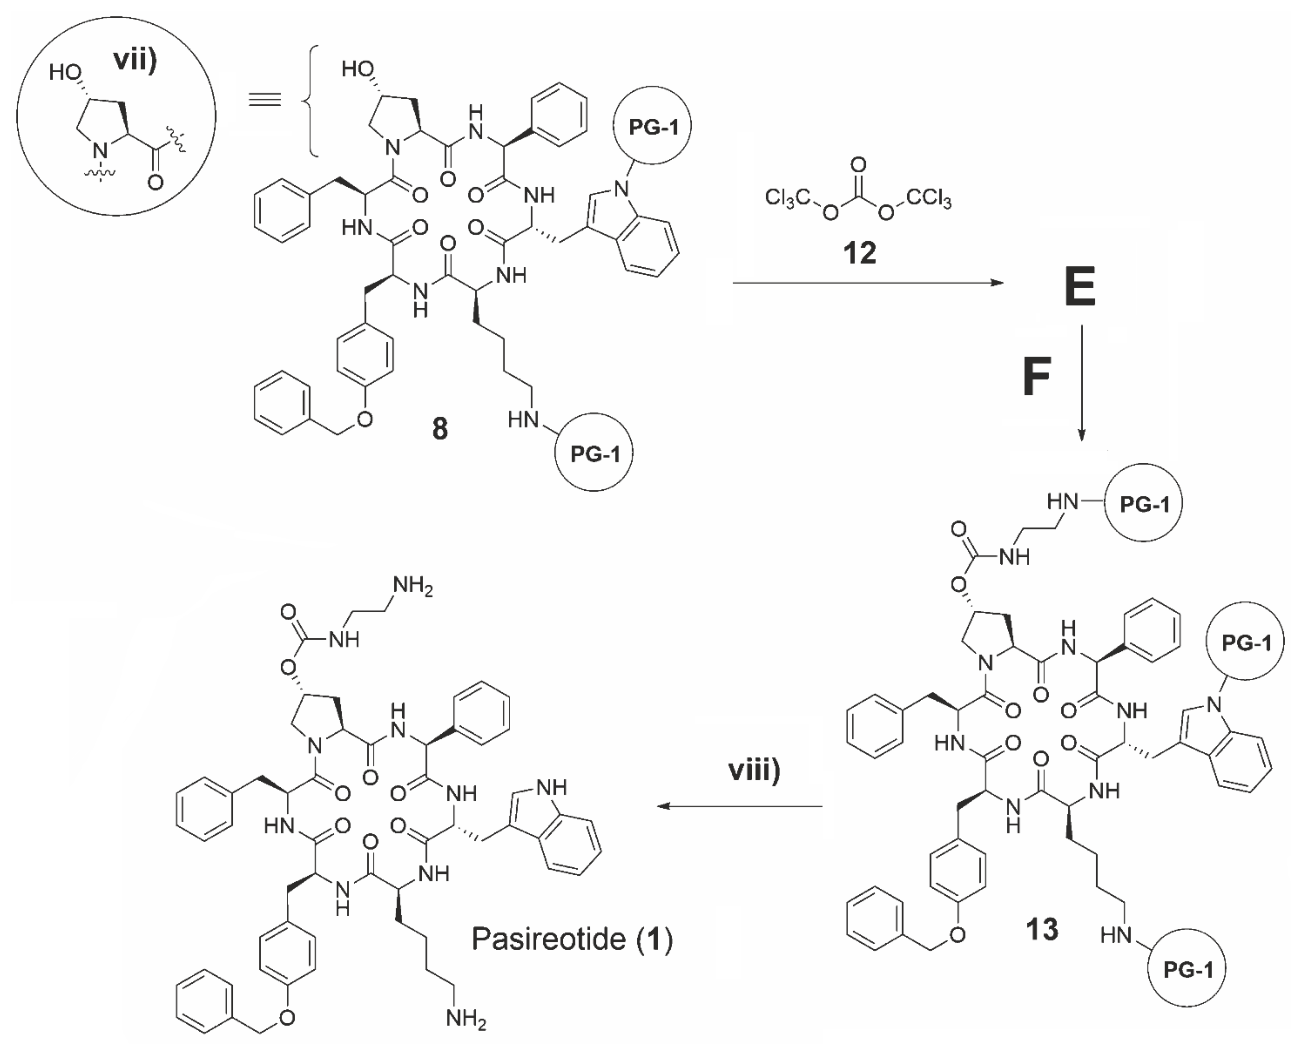
Scheme 4. vii) can be used as simplification of 8; viii) Cleavage of protecting groups
10.6 Draw the structures of intermediate E (including stereochemistry) and reagent F. Abbreviate intermediate 8 as (vii) and the protecting group as PG-1 in structures E and F as depicted in Scheme 5.
10.7 Determine the lowest possible molar equivalents of compound 12 that are necessary to enable full conversion of 8 to 13.
Official English text of the problem.
Internationale Chemie-Olympiade
IChO 2023
Zürich, Schweiz · 10 Theorieaufgaben mit vollständigen Lösungen
Aufgabe 1: Molekulare Bildgebung
Die molekulare Bildgebung ist ein leistungsfähiges Werkzeug der medizinischen Diagnostik. Das Kernisomer \(\ce{^{99m}Tc}\) (m = metastabil) des Isotops \(\ce{^{99g}Tc}\) (g = Grundzustand) besitzt hervorragende Strahlungseigenschaften (\(\gamma\)-Strahler, \(t_{1/2}=6.015\ \mathrm{h}\)) für die nuklearmedizinische Bildgebung. \(\ce{^{99m}Tc}\) wird durch \(\beta^-\)-Zerfall eines Mutternuklids in einem sogenannten Technetiumgenerator als \(\ce{^{99m}Tc}\)-Pertechnetat \(\ce{[^{99m}TcO4]^-}\) gewonnen.
1.1 Bestimmen Sie das Mutternuklid (A) von \(\ce{^{99m}Tc}\) und das emittierte Teilchen (B).
1.2 Geben Sie die Oxidationsstufen des Radiometalls in den folgenden \(\ce{^{99m}Tc}\)-Sonden an.
Die Redoxpotentiale der Elemente der siebten Gruppe Mangan (\(\ce{Mn}\)), Technetium (\(\ce{Tc}\)) und Rhenium (\(\ce{Re}\)) folgen dem allgemeinen Trend im Periodensystem (siehe Abbildung 2 unten).
Abbildung 2
1.3 Berechnen Sie die beiden fehlenden Redoxpotentiale i und ii.
1.4 Vergleichen Sie \(\ce{[MnO4]^-}\), \(\ce{[TcO4]^-}\) und \(\ce{[ReO4]^-}\). Wählen Sie das stärkste Oxidationsmittel aus.
1.5 Entscheiden Sie anhand der in Abbildung 2 auf dem Aufgabenblatt angegebenen Werte, ob \(\ce{TcO2}\) unter sauren Bedingungen zu \(\ce{Tc}\) und \(\ce{TcO4^2-}\) disproportionieren würde.
\(\ce{Tc}\)- und \(\ce{Re}\)-Komplexe in der Oxidationsstufe +V (\(d^2\)-Systeme), die einen terminalen Oxo- (\(\ce{O=}\)) oder Nitridoliganden (\(\ce{N#}\)) enthalten, sind diamagnetisch. Das folgende Schema zeigt drei mögliche Molekülorbital-Energiediagramme.
1.6 Wählen Sie das Orbitalenergiediagramm aus, das den beobachteten Diamagnetismus erklärt. Zeichnen Sie die entsprechende Elektronenkonfiguration in das richtige Diagramm ein.
\(\ce{((C4H9)4N)[^{99g}TcO4]}\) ist ein farbloses Pulver. Durch Zugabe von konz. \(\ce{HCl}\) wird diese gebräuchliche Ausgangsverbindung der \(\ce{^{99g}Tc}\)-Chemie in den grünen Komplex \(\ce{((C4H9)4N)[^{99g}TcOCl4]}\) umgewandelt.
1.7 Schreiben Sie sowohl die Oxidations- als auch die Reduktionshalbreaktion unter Verwendung der Formeln von Ionen oder neutralen Molekülen sowie die vollständige Redoxreaktion auf.
Alle klinisch eingesetzten \(\ce{^{99m}Tc}\)-Radiotracer werden in „Eintopfreaktionen“ unter Verwendung kommerziell erhältlicher Kits hergestellt. Typischerweise hat ein Eluat eines \(\ce{^{99m}Tc}\)-Generators (\(\ce{^{99m}Tc}\) \(t_{1/2}=6.015\ \mathrm{h}\)) eine Aktivität von 12.5 GBq (GBq = Gigabecquerel = \(10^9\) Zerfälle pro Sekunde).
1.8 Berechnen Sie, wie viele Mol \(\ce{^{99m}Tc}\) in solchen Proben enthalten sind.
Für eine Standard-Bildgebung werden dem Patienten etwa 200 MBq \(\ce{^{99m}Tc}\) verabreicht.
1.9 Nehmen Sie an, dass keine Aktivität durch Ausscheidung verloren geht. Berechnen Sie, wie viele Stunden der Patient warten muss, bis die injizierte Aktivität auf unter 1 % der Anfangsaktivität abnimmt.
Die Biokonjugation von Radiometallen ist eine chemische Herausforderung. Ein aktuelles Beispiel ist die (3 + 2)-Cycloaddition von \(\ce{[^{99m}TcO3(tacn)]+}\) (A) (tacn = 1,4,7-Triazacyclononan) mit Alkenen. In diesem Zusammenhang bezieht sich (3 + 2) auf die Anzahl der beteiligten Atome und nicht auf die Anzahl der Elektronen. Das folgende Schema zeigt ein Beispiel dieser Reaktion bei der Markierung eines geschützten Kohlenhydrats.
1.10 Zeichnen Sie die Strukturen der Verbindungen A und B. Geben Sie außerdem die Oxidationsstufe des Technetiums in diesen Verbindungen an.
Aufgabentext aus dem offiziellen englischen Text übersetzt.
Aufgabe 2: Elektrochemische CO2-Reduktion
Elektrochemische \(\ce{CO2}\)-Reduktion
In den letzten Jahren wurde die elektrochemische Umwandlung von \(\ce{CO2}\) in höherwertige Produkte als vielversprechender und technologisch realisierbarer Ansatz angesehen, um die negativen klimatischen Auswirkungen seiner zunehmenden Konzentration in der Atmosphäre abzumildern. Zur Erreichung dieses Ziels wurden mehrere Technologien entwickelt. Unter diesen verdient die elektrochemische Reduktion von \(\ce{CO2}\) (\(\ce{CO2}\)RR) besondere Aufmerksamkeit, da sie mit erneuerbarer Energie betrieben werden kann, um umweltschädliches \(\ce{CO2}\) in Plattformchemikalien umzuwandeln. Elektrokatalysatoren sind nicht nur unerlässlich, um die von Natur aus langsame \(\ce{CO2}\)RR zu beschleunigen, sondern auch, um die Elektrolysereaktion zu den gewünschten Reaktionsprodukten zu lenken. In diesem Zusammenhang bestimmt nicht nur die chemische Natur des Katalysators selbst die resultierende Produktverteilung der \(\ce{CO2}\)RR, sondern auch seine morphologischen Eigenschaften auf verschiedenen Längenskalen. Ein neues Konzept für die Entwicklung von \(\ce{CO2}\)RR-Katalysatoren beruht auf der elektrochemischen Abscheidung schaumartiger Materialien, die eine große, für Reaktanten (z. B. \(\ce{H2O}\), \(\ce{H2}\) und \(\ce{CO2}\)) zugängliche Oberfläche bieten. Materialien auf Kupferbasis sind die einzigen bekannten metallischen \(\ce{CO2}\)RR-Katalysatoren, die durch \(\ce{CO2}\)-Elektrolyse Kohlenwasserstoffe und Alkohole in nennenswerten Mengen erzeugen können.
Im Folgenden sind thermodynamische Daten ausgewählter Stoffe angegeben:
\(\Delta_\mathrm{f}H^\ominus\) (\(\mathrm{kJ\,mol^{-1}}\)) \(S^\ominus\) (\(\mathrm{J\,K^{-1}\,mol^{-1}}\)) \(\ce{H2O(l)}\) −285.83 69.95 \(\ce{O2(g)}\) 0 205.15 \(\ce{H2(g)}\) 0 130.68 \(\ce{CO2(g)}\) −393.52 213.79 Ethanol(l) −276.00 159.86 n-Propanol(l) −302.54 192.80 Tabelle 1. Standardbildungsenthalpie \(\Delta_\mathrm{f}H^\ominus\) und Standardentropie \(S^\ominus\) einiger Stoffe unter Standardbedingungen (\(T=298.15\ \mathrm{K}\), \(p^\ominus=1\ \mathrm{bar}\))
Zellreaktion \(E^\ominus\) gegen SHE (V) \(\ce{Cu^2+ + 2e- = Cu}\) +0.34 \(\ce{2H+ + 2e- = H2}\) 0.00 Tabelle 2. Ausgewählte Halbzellenreaktionen und Standardpotentiale unter Standardbedingungen
2.1 Stellen Sie die Reaktionsgleichungen der Halbzellenreaktionen für die folgenden elektrochemischen Reduktionsprozesse in saurem Milieu auf und gleichen Sie diese aus: (i) \(\ce{CO2}\) zu Ethanol; (ii) \(\ce{CO2}\) zu n-Propanol.
2.2 Kombinieren Sie die Halbzelle des Reduktionsprozesses mit einer \(\ce{H2}/\ce{2H+}\)-Halbzelle, wobei Letztere als Anode dient. Berechnen Sie den Wert des Standardzellpotentials der Reduktion von \(\ce{CO2}\) zu Ethanol.
2.3 Geben Sie alle Reduktions- bzw. Oxidationshalbreaktionen an, die an der Kathode bzw. an der Anode ablaufen.
Abbildung 1 zeigt das Prinzip der Metallabscheidung mithilfe dynamischer Wasserstoffblasen als Templat.
Abbildung 2 zeigt rasterelektronenmikroskopische Aufnahmen in Draufsicht von fünf verschiedenen \(\ce{Cu}\)-Schäumen, die durch Unterbrechung der Metallabscheidung zu unterschiedlichen Zeitpunkten erhalten wurden: 5 s, 20 s, 80 s.
Die elektrochemische Abscheidung von \(\ce{Cu}\)-Schaum (siehe Abbildung 1) wurde in einer wässrigen 1.5 M Schwefelsäurelösung durchgeführt, die 0.2 M Kupfersulfat (\(\ce{CuSO4 * 5H2O}\)) als Kupferquelle enthielt. Eine \(\ce{Cu}\)-Scheibe (\(1\ \mathrm{cm^2}\)) und eine \(\ce{Pt}\)-Folie dienten als Kathode bzw. Anode.
Abbildung 1. Darstellung der elektrochemischen Abscheidung schaumartiger Materialien. Im Verlauf der elektrochemischen Metallabscheidung (schwarze Pfeile) bei hohen Stromdichten in wässrigen Medien findet auf dem metallischen (\(\ce{Cu}\)) Träger (1) die Wasserstoffentwicklungsreaktion (HER) statt. Dadurch wird die Oberfläche teilweise mit \(\ce{H2}\)-Blasen bedeckt (2). Die \(\ce{H2}\)-Blasen dienen als Templat für die Metallabscheidung (3). Als Ergebnis entsteht ein hochporöser Metallschaum (4)
Abbildung 2. \(\ce{Cu}\)-Schäume, die durch galvanostatische elektrochemische \(\ce{Cu}\)-Abscheidung bei einer Stromdichte von \(j=-3\ \mathrm{A\,cm^{-2}}\) erhalten wurden. Die Abscheidung wurde jeweils nach unterschiedlichen Zeitspannen unterbrochen: 5 s, 20 s und 80 s. Der Maßstabsbalken ist in allen Teilbildern gleich
2.4 Ordnen Sie unter Berücksichtigung dieses Mechanismus den in Abbildung 2 gezeigten \(\ce{Cu}\)-Schäumen auf dem Antwortbogen die richtige Abscheidungszeit zu (weiße Kästchen in der oberen linken Ecke).
Bimetallische \(\ce{CuAg}\)-Systeme sind ausgezeichnete Katalysatoren für die Elektrosynthese von Alkoholen aus \(\ce{CO2}\). 5.4 mg eines bimetallischen \(\ce{Cu}\)-\(\ce{Ag}\)-Schaumkatalysators (90 Gew.-% \(\ce{Cu}\), \(M_{\ce{Cu}}=63.546\ \mathrm{g\,mol^{-1}}\); 10 Gew.-% \(\ce{Ag}\), \(M_{\ce{Ag}}=107.868\ \mathrm{g\,mol^{-1}}\)) wurden galvanostatisch auf einer \(\ce{Cu}\)-Folie (\(1\ \mathrm{cm^2}\)) bei einer Stromdichte von \(j=-3\ \mathrm{A\,cm^{-2}}\) abgeschieden, die 20 s lang angelegt wurde (das Minuszeichen kennzeichnet einen reduktiven/kathodischen Prozess).
2.5 Berechnen Sie den Faraday-Wirkungsgrad (FE in %) dieses Metallabscheidungsprozesses. FE ist definiert als \((Q_\mathrm{product}/Q_\mathrm{total})\times100\%\), wobei \(Q\) die Ladung bezeichnet.
Wir betrachten ein \(\ce{CO2}\)-Elektrolyseexperiment, das in 35 mL einer mit \(\ce{CO2}\) gesättigten 0.5 M \(\ce{KHCO3}\)-Elektrolytlösung am bimetallischen \(\ce{Cu}\)-\(\ce{Ag}\)-Schaumkatalysator (90 Gew.-% \(\ce{Cu}\); 10 Gew.-% \(\ce{Ag}\)) durchgeführt wird. Die \(\ce{CO2}\)-Elektrolyse wurde bei einer konstanten (Gesamt-)Stromdichte von \(j(\mathrm{tot})=-30\ \mathrm{mA\,cm^{-2}}\) für 3600 s durchgeführt (beachten Sie, dass die Stromdichte auf die geometrische Oberfläche von \(1\ \mathrm{cm^2}\) normiert ist; das Minuszeichen kennzeichnet einen reduktiven/kathodischen Prozess). Eine nach der Elektrolyse durchgeführte Produktanalyse ergab Massenkonzentrationen von \(41.3\ \mathrm{mg\,L^{-1}}\) bzw. \(7.4\ \mathrm{mg\,L^{-1}}\) für Ethanol bzw. n-Propanol. Beide Alkohole sind flüssige Reaktionsprodukte und reichern sich im Verlauf der Elektrolysereaktion im Elektrolyten an. Wir nehmen an, dass gasförmiger Wasserstoff (\(\ce{H2}\)) als einziges Nebenprodukt des Prozesses gebildet wird.
2.6 Berechnen Sie die für die Bildung von (a) Ethanol (\(M_\mathrm{EtOH}=46.08\ \mathrm{g\,mol^{-1}}\)) und (b) n-Propanol (\(M_\mathrm{PrOH}=60.10\ \mathrm{g\,mol^{-1}}\)) erforderlichen Stromdichten unter der Annahme, dass sich die Stromdichten mit der Elektrolysezeit nicht ändern.
2.7 Berechnen Sie das Volumen des auf der \(1\ \mathrm{cm^2}\) großen Katalysatorfläche gebildeten Wasserstoffs bei 298.15 K und 1 bar unter der Annahme, dass sich der gebildete Wasserstoff ideal verhält und vollständig in die Gasphase übergeht. Falls Sie in Aufgabe 2.6 kein Ergebnis erhalten haben, rechnen Sie mit FE(EtOH) = 45,1 % und FE(PrOH) = 4.8 % weiter.
Aufgabentext aus dem offiziellen englischen Text übersetzt.
Aufgabe 3: Künstliche Photosynthese
Das Forschungsgebiet der künstlichen Photosynthese hat zum Ziel, Sonnenenergie in chemischen Bindungen zu speichern. Photonen werden unter Anregung von Sensibilisatoren absorbiert, wodurch ein ladungsgetrennter Zustand entsteht. Das angeregte Elektron wird auf einen Katalysator zur Wasserstoffentwicklung (hydrogen evolving catalyst, HEC) übertragen, der zweimal reduziert wird und anschließend \(\ce{H2}\) erzeugt. Als Photosensibilisator oder Lichtabsorber dient häufig \(\ce{[Ru(bpy)3]^2+}\) (bpy = 2,2'-Bipyridin), und als HECs werden häufig Cobaltkomplexe eingesetzt.
Energetik der Wasserspaltung
3.1 Berechnen Sie die Enthalpie der Reaktion \(\ce{H2 -> 2H+(aq) + 2e-}\).
Solvatationsenthalpie des Protons: \(\Delta_{\mathrm{aq}}H(\ce{H+})=-1190\ \mathrm{kJ\,mol^{-1}}\)
Ionisierungsenergie von Wasserstoff: \(IE_1=13.6\ \mathrm{eV}\)
Dissoziationsenthalpie von \(\ce{H2}\): \(\Delta_{\mathrm{diss}}H(\ce{H2})=432\ \mathrm{kJ\,mol^{-1}}\)
Im Idealfall läuft die elektrochemische Spaltung von Wasser in \(\ce{O2}\) und \(\ce{H2}\) bei 1.23 V ab. Da \(T\Delta S\) für diesen Prozess positiv ist, wird Wärme aus der Umgebung benötigt. Wenn durch eine zusätzliche Spannung die Wärme erzeugt wird, die zum Ausgleich der Temperaturabnahme erforderlich ist, wird der Prozess als thermoneutral bezeichnet. Die Bildungsenthalpie von \(\ce{H2O}\), \(\Delta_{\mathrm f}H^\circ(\ce{H2O})\), beträgt \(-285\ \mathrm{kJ\,mol^{-1}}\).
3.2 Berechnen Sie (a) die Reaktionsentropie \(\Delta_{\mathrm r}S^\circ\) der Wasserspaltung bei 25 °C für 1 mol \(\ce{H2O}\) und (b) die Spannung, bei der die Wasserspaltung thermoneutral ist.
Katalysatoren
Komplexe vom Cobalt–salen-Typ (Salcomin) sind potenzielle Katalysatoren für die Bildung von \(\ce{H2}\) aus Protonen und Elektronen. Die Struktur von Salcomin ist nachstehend dargestellt:
Abbildung 1. Die Struktur von Salcomin
3.3 Bestimmen Sie die Oxidationsstufe des Cobaltatoms in Salcomin. Bestimmen Sie die geometrische Struktur um das Cobaltzentrum von Salcomin, indem Sie aus den folgenden drei Möglichkeiten wählen: tetraedrisch, quadratisch-planar oder oktaedrisch.
In Lösung kann Salcomin \(\ce{O2}\) binden; dieses verbindet zwei Salcomin-Einheiten, indem es an die beiden Co-Zentren koordiniert. Die Oxidationsstufe beider Co-Zentren ist dann +III.
3.4 Zeichnen Sie die resultierende Struktur.
Die Bildung von \(\ce{H2}\) findet ausschließlich am Cobaltzentrum statt. Die Reaktion wird durch einen vierstufigen Katalysezyklus beschrieben, der mit \(\ce{Co^2+}\) beginnt und 2 \(\ce{H+}\) sowie 2 Elektronen verbraucht. In einem der Schritte wird durch einen intramolekularen Elektronentransfer ein Hydrid gebildet.
3.5 Schreiben Sie zwei mögliche Varianten des Katalysezyklus mit den Ladungen des Komplexes und den Oxidationsstufen des Co-Zentrums auf. Die Oxidationsstufe am Co-Zentrum soll nicht höher als +III sein. Markieren Sie den Schritt der Hydridbildung mit einem Sternchen und kennzeichnen Sie die Aufnahme von \(\ce{H+}\) mit C (chemische Reaktion) und die Elektronenaufnahme mit E (elektrochemische Reaktion); siehe den Beispielzyklus in Abbildung 2 unten. \(\ce{[Co^{II}]}\) steht für den Cobalt–salen-Komplex.
Abbildung 2. Ein Beispielzyklus für Aufgabe 3.5
3.6 Geben Sie anhand der in Tabelle 1 aufgeführten Redoxpotentiale verschiedener Cobaltkomplexe an, welcher Komplex für a) die Wasseroxidation bei neutralem pH-Wert und b) die Wasserreduktion bei neutralem pH-Wert geeignet ist. Schreiben Sie für beide Prozesse die entsprechende Gesamtreaktion auf (nur für die Komplexe, die den jeweiligen Prozess durchführen können) und berechnen Sie das Zellpotential bei neutralem pH-Wert. Das Halbzellenpotential der Protonenreduktion bei pH = 7 und \(T=298\ \mathrm K\) beträgt \(-0.41\ \mathrm V\).
Co(III/II)-Redoxpaar \(E^\circ\) gegenüber der Normalwasserstoffelektrode \(\ce{[Co(H2O)6]}^{3+/2+}\) \(+1.92\ \mathrm V\) \(\ce{[Co(C2O4)3]}^{3-/4-}\) \(+0.55\ \mathrm V\) \(\ce{[Co(EDTA)]}^{1-/2-}\) \(+0.38\ \mathrm V\) \(\ce{[Co(NH3)6]}^{3+/2+}\) \(+0.06\ \mathrm V\) \(\ce{[Co(en)3]}^{3+/2+}\) \(-0.18\ \mathrm V\) \(\ce{[Co(CN)5]}^{2-/3-}\) \(-0.60\ \mathrm V\) Tabelle 1. Mögliche Redoxpaare für Aufgabe 3.6; \(\ce{[C2O4]^2-}\) = Oxalat, en = 1,2-Ethylendiamin.
Ein Blick auf den natürlichen Prozess
Der natürliche Speicher biologischer \(\ce{H2}\)-Äquivalente ist NADPH, das durch Addition eines Hydridions aus \(\ce{NADP+}\) gebildet wird. Die Struktur von NADPH ist in Abbildung 3 dargestellt.
Abbildung 3. Die Struktur von NADPH
3.7 Zeichnen Sie die Struktur von \(\ce{NADP+}\).
Chlorophyll hat bei 680 nm einen Extinktionskoeffizienten von etwa \(\varepsilon=8\times10^4\ \mathrm{M^{-1}\,cm^{-1}}\).
3.8 Berechnen Sie unter Annahme einer Effizienz (Photon zu Wasserstoffatom) von \(\phi=20\ \%\) bei einem Photonenfluss von \(100\ \mathrm{nE\,s^{-1}\,cm^{-2}}\) bei 680 nm (1 E = 1 mol Photonen) a) die Anzahl der Photonen pro Sekunde und b) die Chlorophyllkonzentration in einer \(1\times1\times1\ \mathrm{cm^3}\) großen Küvette, die erforderlich ist, um eine Umsatzfrequenz von \(1\ \mathrm{nmol}\ (\ce{H2})\ \mathrm{s^{-1}}\) zu erreichen.
Aufgabentext aus dem offiziellen englischen Text übersetzt.
Aufgabe 4: Fluorierte und hypervalente Verbindungen
Fluor bildet mit praktisch allen Elementen stabile und isolierbare Verbindungen, einschließlich der Edelgase \(\ce{Kr}\) und \(\ce{Xe}\). Fluorhaltige Moleküle weisen häufig ungewöhnliche Strukturen auf. So ist Fluor häufig an der Bildung von Verbindungen mit Elementen der Gruppen 14–18 beteiligt, die als hypervalent bezeichnet werden. Die Synthese fluorierter organischer Verbindungen beruht heutzutage in hohem Maße auf der Verfügbarkeit gezielt entwickelter Reagenzien; die unten gezeigte Verbindung 4 ist ein Beispiel dafür.
Hinweis: Jedes Element \(E\) in der Reihe \(\mathbf{E^1}\)–\(\mathbf{E^8}\) kann mehr als einmal vorkommen.
Teil I. Molekülgeometrie
4.1 Bestimmen Sie die Elemente \(\mathbf{E^1}\), \(\mathbf{E^2}\), \(\mathbf{E^3}\) und \(\mathbf{E^4}\) in den drei Spezies 1, \(\mathbf{[2]^-}\) und \(\mathbf{[3]^-}\).
1: neutrales, nicht zwitterionisches Molekül, \(\mathbf{E^1}\) quadratisch-pyramidal, \(\mathbf{E^2}\) oktaedrisch, mittlerer Abstand \(d(E^1\!-\!\ce{F})=1.91\ \text{Å}\); mittlerer Abstand \(d(E^2\!-\!\ce{F})=1.58\ \text{Å}\)
\(\mathbf{[2]^-}\): Anion, quadratisch-pyramidal, mittlerer Abstand \(d(E^3\!-\!\ce{F})=1.96\ \text{Å}\)
\(\mathbf{[3]^-}\): Anion, pentagonal-planar, \(d(E^4\!-\!\ce{F})=1.98\ \text{Å}\)
Hinweise:
- Die Molekülgeometrien beziehen sich auf die Anordnung der an \(E^1\)–\(E^4\) gebundenen Atome.
- Die Elementaranalyse von 1 ergibt einen Kohlenstoffgehalt von 17.75 Massen-%.
Gruppe 15 Gruppe 16 Gruppe 17 Gruppe 18 \(d(\ce{P-F})=1.50\text{–}1.68\ \text{Å}\) \(d(\ce{S-F})=1.52\text{–}1.60\ \text{Å}\) \(d(\ce{Cl-F})=1.63\text{–}1.85\ \text{Å}\) \(d(\ce{As-F})=1.68\text{–}1.72\ \text{Å}\) \(d(\ce{Se-F})=1.75\text{–}1.80\ \text{Å}\) \(d(\ce{Br-F})=1.77\text{–}1.97\ \text{Å}\) \(d(\ce{Kr-F})=1.77\text{–}1.89\ \text{Å}\) \(d(\ce{Sb-F})=1.85\text{–}2.05\ \text{Å}\) \(d(\ce{Te-F})=1.80\text{–}2.00\ \text{Å}\) \(d(\ce{I-F})=1.90\text{–}2.00\ \text{Å}\) \(d(\ce{Xe-F})=1.77\text{–}2.00\ \text{Å}\) Tabelle 1. Typische Bereiche der \(\ce{E-F}\)-Bindungslängen für ausgewählte Elemente der Gruppen 15–18
4.2 Wählen Sie die Elemente \(\mathbf{E^5}/\mathbf{E^6}\) bzw. \(\mathbf{E^7}/\mathbf{E^8}\), die die angegebene Geometrie mit \(\ce{E-F}\)-Bindungslängen nahe denen in 1 aufweisen würden (siehe Tabelle 1).
Teil II. Reaktivität und Struktur
Betrachten Sie die unten dargestellte Reaktion:
4.3 Wählen Sie die ideale Geometrie der Verbindung 6 hinsichtlich der Anordnung der Elektronenpaardomänen der Valenzschale um das \(\ce{Te}\)-Atom:
- quadratisch-planar
- quadratisch-pyramidal
- trigonal-bipyramidal
- tetraedrisch
- oktaedrisch
Geben Sie die erwarteten idealen Bindungswinkel \(C^1\!-\!\ce{Te}\!-\!\ce{I}\), \(C^2\!-\!\ce{Te}\!-\!\ce{I}\), \(\ce{I-Te-O}\) und \(C^1\!-\!\ce{Te}\!-\!C^2\) an.
4.4 Geben Sie die Anzahl der \({}^{1}\mathrm{H}\)-NMR-Signale an, die Sie jeweils für die beiden Methylgruppen in den Verbindungen 4 und 6 erwarten.
4.5 Verbindung 6 reagiert nacheinander mit \(\ce{AgF}\) und \(\ce{(H3C)3SiCF3}\) (\(\ce{TMSCF3}\)). Formulieren Sie das \(\ce{Te}\)-haltige Zwischenprodukt A und das Endprodukt B einschließlich ihrer korrekten Geometrie sowie die Nebenprodukte C und D. Zeichnen Sie A und B und geben Sie die Nebenprodukte C und D an. Hinweis: Die molare Masse von D beträgt \(92.08\ \mathrm{g\,mol^{-1}}\).
Nehmen Sie an, dass Verbindung 6 mit einer sterisch anspruchsvollen, chiralen, enantiomerenreinen Lewis-Säure reagiert, beispielsweise mit dem bekannten Borderivat 8, wie unten gezeigt. Diese Reaktion sollte zur Bildung eines neuen Produkts 9 führen, dessen Zusammensetzung der Summe von 6 und 8 entspricht. Nehmen Sie ferner an, dass 9 ein Salz ist, in dem das Kation von 6 und das Anion von 8 abstammt.
4.6 Zeichnen Sie die Struktur sowohl des \(\ce{Te}\)-haltigen Kations als auch des borhaltigen Anions und wählen Sie die ideale Geometrie des Kations hinsichtlich der Anordnung der Elektronenpaardomänen der Valenzschale um das \(\ce{Te}\)-Atom.
Hinweis: Verwenden Sie für 8 (chiral, enantiomerenrein) die folgende schematische Darstellung:
Wählen Sie die ideale Molekülgeometrie des Kations:
- quadratisch-planar
- trigonal-planar
- trigonal-pyramidal
- trigonal-bipyramidal
- tetraedrisch
4.7 Geben Sie die Anzahl der möglichen stereochemisch unterschiedlichen Salze 9 an.
Teil III. Synthese eines \(\lambda^3\)-Difluoriodans und Rotation um eine Einfachbindung
Verbindung 10 wird aus dem Ausgangsstoff 8 durch Oxidation mit Trichlorisocyanursäure (TCICA, 9) in Gegenwart von überschüssigem \(\ce{KF}\) in trockenem Acetonitril hergestellt, wie unten gezeigt.
4.8 Formulieren Sie ausgeglichene Halbreaktionen und eine ausgeglichene Gesamtreaktion für diesen Prozess.
Hinweis: Kürzen Sie 10 als \(\ce{R-I}\), 11 als \(\ce{R-IF2}\) und TCICA als \(\ce{C3Cl3N3O3}\) ab. Der sechsgliedrige Ring von TCICA bleibt bei der Reduktion intakt.
Die \(\ce{IF2}\)-Gruppe in 12 kann um die \(\ce{I-C}\)-Bindung rotieren (stellen Sie sich einen molekularen Propeller vor). Die entsprechende Rotationsbarriere wurde experimentell gemessen: \(E_\mathrm{a}=30\ \mathrm{kJ\,mol^{-1}}\). Außerdem beträgt die Geschwindigkeitskonstante der Rotation \(k=2500\ \mathrm{s^{-1}}\) bei \(228\ \mathrm{K}\).
4.9 Bestimmen Sie, wie schnell die \(\ce{IF2}\)-Gruppe bei Raumtemperatur (\(298\ \mathrm{K}\)) prinzipiell rotieren kann. Betrachten Sie diesen Prozess wie eine chemische Reaktion, für die Sie die Geschwindigkeitskonstante bestimmen. Schreiben Sie Ihre Antwort auf das Antwortblatt. Die Einheit der Konstante soll in \(\mathrm{s^{-1}}\) angegeben werden.
Aufgabentext aus dem offiziellen englischen Text übersetzt.
Aufgabe 5: Hydrodesulfurierung
Die Herstellung schwefelfreier Kraftstoffe entspricht dem allgemeinen Bestreben, die Emission umweltschädlicher schwefelhaltiger Verbindungen zu verringern. Zur Entfernung von Schwefel wird in Raffinerien die Hydrodesulfurierung unter Einsatz von Wasserstoff angewendet.
5.1 Zeichnen Sie die Strukturen der Produkte A bis E der Hydrodesulfurierung von Thiophen. Dabei ist bekannt, dass A und B cyclische Regioisomere sind und C cyclisch ist.
Abbildung 1. Hydrodesulfurierung von Thiophen
Die beiden häufigsten natürlichen stabilen Isotope des Schwefels sind \(\ce{^{32}S}\) und \(\ce{^{34}S}\) mit relativen Stoffmengenanteilen von \(x(\ce{^{32}S})=94.8\,\%\) bzw. \(x(\ce{^{34}S})=4.37\,\%\). Die natürlichen stabilen Isotope des Wasserstoffs sind \(\ce{^{1}H}\) und \(\ce{^{2}H}\) (\(\ce{D}\)) mit relativen Stoffmengenanteilen von \(x(\ce{^{1}H})=99.986\,\%\) bzw. \(x(\ce{^{2}H})=0.014\,\%\).
5.2 Listen Sie unter ausschließlicher Berücksichtigung der oben genannten Isotope alle Isotopologe von \(\ce{H2S}\) auf.
5.3 Listen Sie unter ausschließlicher Berücksichtigung der oben genannten Isotope alle Isotopologe von \(\ce{H2S}\) auf, die gleichzeitig \(\ce{D}\)- und \(\ce{^{34}S}\)-Kerne enthalten, und berechnen Sie für jedes den jeweiligen relativen Stoffmengenanteil in %.
Die Entschwefelung ist ein katalytischer Prozess, der typischerweise an einem Katalysator aus \(\ce{MoS2}\) auf einem \(\ce{SiO2}\)-Träger (\(\ce{MoS2}/\ce{SiO2}\)) durchgeführt wird. Zur Untersuchung der Katalysatoroberfläche können Isotopenaustauschmethoden eingesetzt werden. Die Isotopenaustauschreaktion findet an der Grenzfläche zwischen Gas und Feststoff statt, wobei ausschließlich die Oberflächenatome ausgetauscht werden. In erster Näherung nehmen die Atome im Inneren des Feststoffs nicht am Austausch teil (Abbildung 2).
Im Experiment wurde der Isotopenaustausch zwischen dem \(\ce{MoS2}/\ce{SiO2}\)-Katalysator (Mo-Massenanteil \(w_{\mathrm{Mo}}=4.280\,\%\), anfangs ausschließlich \(\ce{^{32}S}\) enthaltend) und gasförmigem, isotopenmarkiertem \(\ce{H2^{34}S}\) in einem Durchflussreaktor untersucht (Abbildung 2). Der \(\ce{MoS2}/\ce{SiO2}\)-Katalysator (\(m_{\mathrm{cat}}=1.2350\,\mathrm{g}\)) wurde einem Gasstrom (\(p=1.00\,\mathrm{bar}\), \(v=20.0\,\mathrm{mL\,min^{-1}}\), \(T=23.0\,^\circ\mathrm{C}\)) aus einem Gemisch von \(\ce{H2^{34}S}\) und \(\ce{Ar}\) als Restgas ausgesetzt (Volumenanteil \(\varphi(\ce{H2^{34}S})=1.00\,\%\), Isotopenreinheit von \(\ce{^{34}S}\): \(\alpha=99.95\ \text{mol.}\,\%\)). Die Versuchsdauer betrug \(t=10.0\,\mathrm{min}\), und das austretende Gas wurde während des gesamten Experiments gesammelt. Der gemessene Anteil des Isotops \(\ce{^{34}S}\) an den Schwefelatomen (\(\gamma\)) in der gesammelten Gasphase betrug \(\gamma=87.3\ \text{mol.}\,\%\). Nehmen Sie ideales Gasverhalten an sowie, dass die elementare (nicht die isotopische!) Zusammensetzung von \(\ce{MoS2}\) an der Oberfläche und im Inneren identisch ist und bis zum Ende des Experiments alle Schwefelatome der Oberfläche mit der Gasphase ausgetauscht werden.
Abbildung 2. Schematische Darstellung des Experiments während seines Verlaufs (A) und im Endzustand (B). Schwefelatome an der Oberfläche sind rot dargestellt, Schwefelatome im Inneren blau. Molybdänatome sind nicht dargestellt.
5.4 Berechnen Sie die Stoffmenge der ausgetauschten Schwefelatome \(n(\ce{S})_{\mathrm{surface}}\) in mol.
Falls Sie die Stoffmenge der ausgetauschten Schwefelatome nicht berechnen konnten, verwenden Sie in allen folgenden Berechnungen den Wert \(1.53\times10^{-5}\,\mathrm{mol}\).
Nehmen Sie an, dass die \(\ce{MoS2}\)-Phase aus gleich großen kugelförmigen Partikeln besteht und am Ende des Experiments alle Schwefelatome an der Oberfläche ausgetauscht sind, während die Atome im Inneren nicht an der Austauschreaktion teilgenommen haben. Die Dichte von \(\ce{MoS2}\) beträgt \(\rho=5.06\,\mathrm{g\,cm^{-3}}\); die mittlere Fläche, die \(\ce{S}\)- bzw. \(\ce{Mo}\)-Atome an der Oberfläche einnehmen, beträgt \(A_{\mathrm{S}}=3.00\times10^{-19}\,\mathrm{m^2}\) bzw. \(A_{\mathrm{Mo}}=5.00\times10^{-19}\,\mathrm{m^2}\). Die Oberfläche einer Kugel mit dem Radius \(R\) kann als \(S=4\pi R^2\) und ihr Volumen als \(V=(4/3)\pi R^3\) berechnet werden. Nehmen Sie an, dass die Isotopenzusammensetzung die Dichte von \(\ce{MoS2}\) nicht beeinflusst.
5.5 Berechnen Sie den Partikelradius \(R\) der \(\ce{MoS2}\)-Partikel. Geben Sie Ihre Antwort in nm an.
Tatsächlich diffundieren die isotopenmarkierten Atome von der Oberfläche ins Innere, während die nicht markierten Atome aus dem Inneren an die Oberfläche wandern und dabei allmählich ausgetauscht werden (Abbildung 3A). Daher nimmt zu einem gegebenen Zeitpunkt der Anteil der markierten Atome innerhalb des Partikels von der Partikeloberfläche zum Zentrum hin ab. Gleichzeitig nimmt mit zunehmender Austauschdauer die Beteiligung der Atome im Inneren an der Austauschreaktion zu, wie in Abbildung 3B skizziert.
Abbildung 3. A) Schematische Darstellung der Diffusion von Schwefelisotopen von der Oberfläche ins Innere eines \(\ce{MoS2}\)-Partikels. Schwefelatome an der Oberfläche sind rot dargestellt, Schwefelatome im Inneren blau. Molybdänatome sind nicht dargestellt. B) Anteil der \(\ce{^{34}S}\)-Atome im Inneren als Funktion der Zeit und des Abstands vom Partikelzentrum; \(r_{\mathrm{edge}}\) entspricht dem Radius des \(\ce{MoS2}\)-Partikels.
Am Ende des Experiments sind die Oberflächenatome vollständig ausgetauscht, und zusätzlich ist ein Teil der Atome im Inneren durch Diffusion ausgetauscht. Der Anteil der ausgetauschten Atome im Inneren, \(n(\ce{S})_{\mathrm{bulk}}^{\mathrm{ex}}\), an der Gesamtzahl der Schwefelatome im Inneren, \(n(\ce{S})_{\mathrm{bulk}}^{\mathrm{total}}\), lässt sich wie folgt berechnen:
\[ F=n(\ce{S})_{\mathrm{bulk}}^{\mathrm{ex}}/ n(\ce{S})_{\mathrm{bulk}}^{\mathrm{total}} =1-\exp(-Dt/R^2) \]
Dabei ist \(t\) die Dauer des oben beschriebenen Austauschexperiments, \(R\) der Partikelradius und \(D\) der Diffusionskoeffizient. Der oben beschriebene Katalysator wurde unabhängig davon mittels Elektronenmikroskopie untersucht. Diese zeigte, dass die \(\ce{MoS2}\)-Partikel gleichmäßig verteilte Kugeln mit einem Radius von \(35.0\,\mathrm{nm}\) sind.
5.6 Berechnen Sie mit \(R=35.0\,\mathrm{nm}\) und den Daten des oben beschriebenen Austauschexperiments den Diffusionskoeffizienten \(D\) (in \(\mathrm{m^2\,s^{-1}}\)) für die Diffusion von Schwefelatomen in \(\ce{MoS2}\). Verwenden Sie bei Ihren Berechnungen die Näherung \(e^x\approx1+x\) für \(x\ll1\).
Aufgabentext aus dem offiziellen englischen Text übersetzt.
Aufgabe 6: Direkte Umwandlung von Methan zu Methanol
Methan ist als Erdgas in großem Umfang verfügbar und daher ein attraktiver Rohstoff für die chemische Industrie, beispielsweise zur Herstellung von Methanol. Die Kontrolle dieses Prozesses ist jedoch schwierig, da Methanol leichter oxidiert wird als Methan. Eine Überoxidation wird durch ein chemisches Kreislaufverfahren vermieden, bei dem aktive Zentren kupferausgetauschter Zeolithkatalysatoren nur das einzelne Sauerstoffatom bereitstellen, das für die Oxidation zu Methanol benötigt wird, und dabei verbraucht werden. In einem zweiten Schritt wird der Katalysator in Abwesenheit von Methan mit Sauerstoff regeneriert. Das folgende Schema zeigt zwei mögliche katalytische Kupferzentren. Während der Reaktion wird Cu(II) zu Cu(I) reduziert.
6.1 Geben Sie die Anzahl der S1-Zentren und die Anzahl der S2-Zentren an, die benötigt werden, um ein Methanmolekül zu Methanol zu oxidieren.
In Abwesenheit von Sauerstoff desorbiert das gebildete Methanol nicht vom Zeolith. Wird die Reaktion in einem Behälter bei konstantem Volumen und konstanter Temperatur (einem Autoklaven) durchgeführt, ergibt sich ein Druckabfall ausschließlich aus dem Verbrauch von Methan, das als ideales Gas betrachtet werden kann. In einem 1-L-Autoklaven mit 200 mg Zeolith, der mit 4.3 Massen-% Kupfer beladen war, sank der anfängliche Methandruck \(p_0 = 933\ \mathrm{Pa}\) nach Abschluss der Reaktion bei 528 K auf \(p_\infty = 925\ \mathrm{Pa}\).
6.2 Berechnen Sie den prozentualen Anteil des Kupfers, der reagiert hat.
6.3 In Abbildung 1 sind experimentelle Daten dargestellt. Entscheiden Sie anhand dieser Daten über die (Pseudo-)Reaktionsordnung der Oxidation von \(\ce{CH4}\).
(a) Die Reaktion ist von (pseudo-)nullter Ordnung.
(b) Die Reaktion ist von (pseudo-)erster Ordnung.
(c) Die Reaktion ist von (pseudo-)zweiter Ordnung.
Abbildung 1. Halblogarithmische Darstellung des normierten Methandrucks gegen die Zeit für die Reaktion mit kupferbeladenem Zeolith, der die Zentren S1 und S2 enthält, in einem Autoklaven bei verschiedenen Temperaturen. Die Symbole kennzeichnen experimentelle Datenpunkte. Die durchgezogenen Linien sind lineare Anpassungen an geeignete Zeitbereiche. Die gepunkteten Linien dienen der visuellen Orientierung
6.4 Geben Sie das (Pseudo-)Geschwindigkeitsgesetz für die Oxidation von \(\ce{CH4}\) an, das unter den gegebenen Bedingungen mit den experimentellen Daten übereinstimmt. Beachten Sie, dass es sowohl von den Konzentrationen von \(\ce{CH4}\) und der Zentren S1 und S2 als auch von den Geschwindigkeitskonstanten abhängen kann.
6.5 Wählen Sie die richtige(n) Aussage(n) aus.
(a) Mindestens zwei Arten von Kupferzentren reagieren, jeweils mit einer unterschiedlichen Geschwindigkeitskonstante.
(b) Die gesamte Methanoxidation durch den Zeolith verläuft bei höherer Temperatur schneller.
(c) Bei höherer Temperatur hat nach Abschluss der Reaktion ein größerer Anteil der Kupferzentren mit Methan reagiert.
(d) Eine der Reaktionen wird bei höherer Temperatur langsamer.
Paramagnetische S1-Zentren können mittels Elektronenparamagnetischer Resonanzspektroskopie (EPR-Spektroskopie) beobachtet werden, während diamagnetische S2-Zentren kein EPR-Signal liefern. Die EPR-Spektroskopie misst die Anzahl der Elektronenspins. Daher ist die Anzahl der S1-Zentren proportional zum Doppelintegral \(I_2\) des EPR-Spektrums, d. h. \([\mathbf{S1}] \propto I_2\). Die Spektren wurden bei verschiedenen Temperaturen \(T\) und bei jeder Temperatur zu verschiedenen Zeiten \(t\) nach Beginn der Reaktion gemessen.
6.6 Leiten Sie die in der Zeit lineare Gleichung her, die \(I_2(t)\) mit der Geschwindigkeitskonstante für die Abnahme der S1-Zentren verknüpft.
6.7 Kreuzen Sie auf dem Antwortbogen die Kästchen für jede Messung an, die mit einem bekannten Cu(II)-Standard kalibriert werden muss.
(a) Gesamtzahl der paramagnetischen Cu(II)-Zentren in der Probe.
(b) Konzentration der paramagnetischen Cu(II)-Zentren in der Probe.
(c) Geschwindigkeitskonstante.
(d) Arten der verschiedenen paramagnetischen Cu(II)-Spezies in der Probe.
Aus EPR-Messungen ist bekannt, dass die Geschwindigkeitskonstante für die Reaktion mit S1-Zentren bei 528 K \(2.604 \times 10^{-3}\ \mathrm{s^{-1}}\) beträgt.
6.8 Entscheiden Sie unter Berücksichtigung von Abbildung 1 und anhand einer Berechnung, ob Methan mit S2-Zentren schneller oder langsamer reagiert als mit S1-Zentren.
(a) Methan reagiert schneller mit S1.
(b) Beide Reaktionsgeschwindigkeiten sind gleich.
(c) Methan reagiert schneller mit S2.
Methanol kann mit verschiedenen Zeolithkatalysatoren zu wertvollen Olefinen weiterverarbeitet werden. Bei diesem Prozess beobachtet man ein Zwischenprodukt mit einer molaren Masse von \(86.09\ \mathrm{g\,mol^{-1}}\), einer Elementaranalyse (55.8 Massen-% \(\ce{C}\), 7.0 Massen-% \(\ce{H}\)) und einem \({}^{1}\mathrm{H}\)-NMR-Spektrum mit Signalen bei vier verschiedenen chemischen Verschiebungen:
a: 12.2 ppm (1H, s), breit, verschwindet bei Zugabe von \(\ce{D2O}\)
b: 6.3 ppm (1H, d)
c: 5.7 ppm (1H, d)
d: 2.0 ppm (3H, s)
6.9 Zeichnen Sie die Struktur des Zwischenprodukts und ordnen Sie die Protonen a und d zu.
Das Energieministerium der Vereinigten Staaten hat zwölf chemische Verbindungen, die ausschließlich \(\ce{C}\), \(\ce{H}\) und \(\ce{O}\) enthalten, als Plattformchemikalien eingestuft. Diese sind die vielversprechendsten Kandidaten, die sich leicht aus nachwachsenden Rohstoffen herstellen lassen und aus denen zahlreiche Zielderivate hergestellt werden können. Eine davon ist die Verbindung A, die entweder weiter derivatisiert oder beispielsweise für medizinische Anwendungen oder in Waschmitteln verwendet werden kann.
- \({}^{1}\mathrm{H}\)-NMR in DMSO: 7.81 ppm (a, s), 13.0 ppm (b, s, breit, verschwindet bei Zugabe von \(\ce{D2O}\)), beide Signale haben das gleiche Integral.
- \({}^{13}\mathrm{C}\)-NMR: 165.1 ppm (1), 150.6 ppm (2) und 120.6 ppm (3).
- \(M = 156.03\ \mathrm{g\,mol^{-1}}\). Elementaranalyse: 46.15 Massen-% \(\ce{C}\), 2.56 Massen-% \(\ce{H}\).
6.10 Geben Sie eine mögliche Struktur von A an und ordnen Sie alle Protonen sowie das Kohlenstoffatom 1 zu.
Aufgabentext aus dem offiziellen englischen Text übersetzt.
Aufgabe 7: Enzymkinetik
Der 1913 eingeführte Michaelis–Menten-Mechanismus (MM-Mechanismus) beschreibt die Kinetik der Enzymkatalyse. Bei diesem Mechanismus katalysiert das Enzym \(\ce{E}\) die Umwandlung des Substrats \(\ce{S}\) in das Produkt \(\ce{P}\):
Die Anfangsgeschwindigkeit einer enzymatischen Reaktion, die dem MM-Mechanismus folgt, ist gegeben durch
\[ v_0=v_{\max}\frac{[\ce{S}]_0}{K_{\mathrm M}+[\ce{S}]_0} \tag{1} \]
wenn die Anfangskonzentration von \(\ce{E}\) wesentlich kleiner ist als die Anfangskonzentration von \(\ce{S}\), \([\ce{E}]_0\ll[\ce{S}]_0\). Die Michaelis-Konstante ist definiert als \(K_{\mathrm M}=(k_2+k_3)/k_1\). Die Anfangsgeschwindigkeit lässt sich auch als Produkt des relativen Flusses \(j\) und \([\ce{E}]_0\) ausdrücken:
\[ v_0=j[\ce{E}]_0 \tag{2} \]
Hinweis: Bei den Fragen 7.1 und 7.2 kann eine, können mehrere oder keine der Antworten richtig sein.
7.1 Wählen Sie die korrekte(n) alternative(n) Form(en) der Ausdrücke (1) und (2) für die Anfangsgeschwindigkeit (\(v_0\)).
\([\ce{ES}]_{\max}\) ist die maximale Konzentration des \(\ce{ES}\)-Komplexes.
- (a) \(\displaystyle v_0=\frac{k_3[\ce{E}]_0[\ce{S}]_0}{K_{\mathrm M}+[\ce{S}]_0}\)
- (b) \(\displaystyle v_0=\frac{k_3[\ce{E}]}{K_{\mathrm M}/[\ce{S}]_0+1}\)
- (c) \(\displaystyle v_0=j[\ce{ES}]_{\max}\)
- (d) \(\displaystyle v_0=\frac{k_3[\ce{E}]_0[\ce{ES}]_{\max}}{K_{\mathrm M}+[\ce{S}]_0}\)
- (e) \(\displaystyle v_0=\frac{k_3[\ce{E}]_0}{K_{\mathrm M}/[\ce{S}]_0+1}\)
- (f) \(\displaystyle v_0=\frac{j[\ce{E}]_0}{K_{\mathrm M}+[\ce{S}]_0}\)
7.2 Wählen Sie die Achsenpaare (\(y\) gegen \(x\)), bei denen eine lineare Auftragung zu erwarten ist.
- (a) \(v_0\) gegen \(1/[\ce{S}]_0\)
- (b) \(v_0\) gegen \(v_0/K_{\mathrm M}\)
- (c) \(v_0\) gegen \(K_{\mathrm M}/v_0\)
- (d) \(1/v_0\) gegen \(v_0/[\ce{S}]_0\)
- (e) \(1/v_0\) gegen \(v_0/K_{\mathrm M}\)
- (f) \([\ce{S}]_0/v_0\) gegen \([\ce{S}]_0\)
Viele Enzyme katalysieren Umsetzungen mit mehreren Substraten statt mit nur einem Substrat. Wenn jedoch die Konzentration eines der Substrate wesentlich höher ist als die des anderen Substrats oder konstant gehalten wird, gilt ebenfalls die MM-Kinetik. Hier betrachten wir zwei voneinander unabhängige enzymatische Systeme, die der MM-Kinetik folgen.
Enzymatisches System I
Das Enzym \(\ce{E}\) wandelt die Substrate \(\ce{A}\) und \(\ce{B}\) in die Produkte \(\ce{P_A}\) und \(\ce{P_B}\) um. Bei einem sich schnell einstellenden vorgelagerten Gleichgewicht zwischen dem freien Enzym und allen Enzym-Substrat-Komplexen gilt die folgende Gleichung:
\[ v_0= \frac{k[\ce{E}]_0[\ce{A}]_0[\ce{B}]_0} {(K+[\ce{A}]_0)(K+[\ce{B}]_0)} \tag{3} \]
Dabei ist \(k\) die Geschwindigkeitskonstante einer der Reaktionen. Dieselbe Gleichgewichtskonstante \(K\) beschreibt die Dissoziation beider Substrate vom jeweiligen aktiven Zentrum von \(\ce{E}\).
7.3 Zeigen Sie, dass Gleichung (3) die MM-Form (1) annimmt, wenn die Konzentration des Substrats \(\ce{B}\) auf einem konstanten Wert \(c_0\) gehalten wird. Geben Sie den Ausdruck für \(v_{\max}\) in diesem Fall an.
7.4 Schlagen Sie für das Enzymatische System I ein kinetisches Schema vor, das mit Gl. (3) übereinstimmt und alle Zwischenstufen und Produkte zeigt. Kennzeichnen Sie die Reaktion mit der Geschwindigkeitskonstante \(k\).
Enzymatisches System II
Das Enzym \(\ce{E}\) besitzt fünf aktive Zentren, von denen jedes spezifisch für eines der Substrate \(\ce{S_A}\), \(\ce{S_B}\) oder \(\ce{S_C}\) ist, die selektiv in die jeweiligen Produkte \(\ce{P_A}\), \(\ce{P_B}\) oder \(\ce{P_C}\) umgewandelt werden. Für jedes Substrat gibt es mindestens ein aktives Zentrum. Jedes aktive Zentrum ist von den anderen unabhängig.
Über \(\ce{E}\) ist Folgendes bekannt:
-
Die Affinität zu \(\ce{S_C}\) ist höher als zu \(\ce{S_B}\).
-
Die Auftragung von \(v_{0i}\) gegen \(v_{0i}/[\ce{S_i}]_0\), die als Eadie–Hofstee-Diagramm bezeichnet wird, ist für \(\ce{S_A}\), \(\ce{S_B}\), \(\ce{S_C}\) unten dargestellt. Die Geschwindigkeit ist dabei pro aktivem Zentrum angegeben (\(v_{0i}\)); die Skalierung und die Legende wurden jedoch weggelassen.
-
Wenn \(\ce{E}\) mit \(\ce{S_A}\), \(\ce{S_B}\), \(\ce{S_C}\) gesättigt ist, beträgt die katalytische Wechselzahl (TON) für \(\ce{S_C}\) pro Zentrum \(10200\ \mathrm{min^{-1}}\), und insgesamt werden pro Sekunde 2023 Moleküle der Produkte \(\ce{P_A}\), \(\ce{P_B}\), \(\ce{P_C}\) synthetisiert. Gleichzeitig wird die Bildung von höchstens \(5.94\times10^6\) Molekülen von \(\ce{P_A}\) und \(\ce{P_B}\) pro Stunde nachgewiesen.
-
Bei äquimolaren Konzentrationen von \(\ce{S_A}\), \(\ce{S_B}\), \(\ce{S_C}\), die mindestens um den Faktor 1000 kleiner sind als die entsprechenden \(K_{\mathrm M,i}\)-Werte, werden die Konzentrationen von \(\ce{P_A}\), \(\ce{P_B}\), \(\ce{P_C}\) proportional zur katalytischen Effizienz \((\varepsilon_i=k_{i3}/K_{\mathrm M,i})\), und ihr Verhältnis beträgt in dieser Reihenfolge \(3:2:5\).
-
Zwei \(\ce{ES_i}\)-Komplexe haben gleiche Geschwindigkeitskonstanten für die Dissoziation zu \(\ce{E}\) und \(\ce{S_i}\). Die Aktivierungsbarriere für die Reaktion von \(\ce{ES_C}\) zu den Ausgangsverbindungen ist um \(1266\ \mathrm{J\,mol^{-1}}\) höher als für die Reaktion zu den Endprodukten. Nehmen Sie an, dass die präexponentiellen Faktoren für beide Reaktionen gleich sind und \(T=25\,^\circ\mathrm C\) gilt.
-
Für die Reaktion \(\ce{E + S_i}\) gilt: \(k_{\mathrm{c1}}=1.57\times10^7\ \mathrm{M^{-1}\,s^{-1}}\) und \(k_{\mathrm{a1}}=k_{\mathrm{b1}}\).
7.5 Füllen Sie die folgende Tabelle aus und geben Sie Ihre Berechnungen an. Hinweise:
- Bestimmen Sie anhand der Informationen aus den Punkten 1 und 2 die Beziehung (\(<\), \(>\), \(=\)) zwischen den Konstanten \(K_{\mathrm M,A}\), \(K_{\mathrm M,B}\) und \(K_{\mathrm M,C}\).
- Mithilfe der Informationen aus den Punkten 3 und 5 können Sie die erste Spalte (Anzahl der aktiven Zentren für jedes Substrat) und die letzte Zeile (alle Konstanten für das Substrat \(\ce{S_C}\)) der Tabelle ausfüllen. Überprüfen Sie, dass die Summe der aktiven Zentren gleich 5 ist.
Anzahl aktiver Zentren \(k_1\) \(k_2\) \(k_3\) \(K_{\mathrm M}\) \(\ce{S_A}\) \(\ce{S_B}\) \(\ce{S_C}\) \(1.57\times10^7\ \mathrm{M^{-1}\,s^{-1}}\) Aufgabentext aus dem offiziellen englischen Text übersetzt.
Aufgabe 8: Nazarov-Reaktion
Die Nazarov-Reaktion ist eine häufig verwendete Reaktion von Divinylketonen zu Cyclopentenonen. Sie verläuft entweder photochemisch oder säurekatalysiert und ist eine Elektrocyclisierung, auf die eine Protonenübertragung folgt.
8.1 Zeichnen Sie die π-Molekülorbitale zur Beschreibung der Nazarov-Reaktion. Besetzen Sie die jeweiligen Energieniveaus mit Elektronen. Markieren Sie mit einem x (i) das HOMO (höchstes besetztes Molekülorbital) und (ii) das LUMO (niedrigstes unbesetztes Molekülorbital). Für diese Aufgabe können Sie das Divinylketon als Pentadienyl-Kation mit fünf p-Orbitalen betrachten.
8.2 Sagen Sie anhand der π-Molekülorbitale, die Sie in Aufgabe 8.1 hergeleitet haben, voraus, unter welchen Bedingungen die Nazarov-Reaktion des Divinylketons disrotatorisch bzw. konrotatorisch verläuft. Markieren Sie in der Tabelle mit einem x die Bedingungen, unter denen die Reaktion erlaubt ist.
Disrotatorisch Konrotatorisch Thermisch Photochemisch 8.3 Die Nazarov-Reaktion wurde als Schlüsselreaktion in einer Synthese von Farnesin eingesetzt. Zeichnen Sie für beide unten angegebenen Bedingungen jeweils eine mögliche Struktur von A und B, einschließlich der Stereochemie. Beachten Sie, dass die Produkte beider Reaktionen im \(\ce{^1H}\)-NMR-Spektrum ein Signal bei 6.70–6.73 ppm zeigen.
Die Synthese von Capnellen beginnt mit dem unten gezeigten ungesättigten Aldehyd C. Die Behandlung mit D und anschließende Umsetzung mit auf Kohlenstoff geträgertem \(\ce{MnO2}\) ergaben das unten gezeigte Divinylketon E. Die Behandlung mit einem Gemisch aus \(\ce{P2O5}\) und MsOH lieferte F, das über eine Reaktionsfolge in das ungesättigte Keton I überführt wurde.
8.4 Wählen Sie aus der Liste das bzw. die Reagenzien aus, die als D geeignet wären.
(a) \(\ce{H2C=CHMgBr}\) (c) \(\ce{H2C=CHBr}\), \(\ce{Pd(PPh3)4}\)
(b) 1. \(\ce{NaBH4}\) 2. \(\ce{H2C=CHLi}\) (d) \(\ce{H2C=CHMgBr}\), \(\ce{CuI}\)
8.5 Geben Sie die Strukturen der Zwischenprodukte F, G und H einschließlich ihrer Stereochemie an.
Das Enon I wurde anschließend mit \(\ce{H2C=CHMgBr}\) und \(\ce{CuI}\) in THF zum Zwischenprodukt J umgesetzt. Durch anschließende Ozonolyse entstand das Zwischenprodukt K, das im \(\ce{^1H}\)-NMR-Spektrum ein Signal bei 9.61 ppm zeigt. Die Behandlung mit 5-%iger \(\ce{KOH}\) in einem Gemisch aus THF und Ether lieferte das Zwischenprodukt L. Hydrierung mit einem Pt-Katalysator unter einer \(\ce{H2}\)-Atmosphäre ergab M, aus dem schließlich Capnellen erhalten wurde.
8.6 Geben Sie die Strukturen von J, K, L und M einschließlich ihrer Stereochemie an.
Aufgabentext aus dem offiziellen englischen Text übersetzt.
Aufgabe 9: Elektrolyse in der organischen Synthese
Die Kolbe-Elektrolyse beschreibt die decarboxylierende Dimerisierung zweier Carbonsäuren und läuft nur ab, wenn die Säure deprotoniert ist. Die nicht ausgeglichene Reaktionsgleichung ist hier dargestellt.
Bei der Reaktion entstehen zwei Gase (B und C). B reagiert mit \(\ce{Ca(OH)2}\), während C leicht entzündlich ist.
9.1 Geben Sie die Strukturformeln von A, B und C an.
9.2 Die Synthese ist formal eine Redoxreaktion, bei der das Carboxylat oxidiert und das Lösungsmittel reduziert wird. Formulieren Sie die Oxidations- und Reduktionshalbreaktionen sowie die gesamte Redoxreaktion.
9.3 Geben Sie die Zwischenprodukte 1 und 2 im Mechanismus der oxidativen Decarboxylierung und der Produktbildung an.
Die Kolbe-Elektrolyse ist gewöhnlich nur bei langkettigen gesättigten Carbonsäuren effizient, nicht aber bei bestimmten Carbonsäuren wie D. Hier ist die Weiteroxidation des radikalischen Zwischenprodukts E zu einer positiv geladenen Spezies F begünstigt. Das Zwischenprodukt F kann mit Nukleophilen reagieren und verschiedene Nebenprodukte bilden; beispielsweise reagiert es mit D zum Ester G und mit \(\ce{MeOH}\) zu H.
9.4 Geben Sie die Strukturen von D–H an.
Die Elektrolyse der Carbonsäure I in Gegenwart eines Überschusses der als Reaktionspartner eingesetzten Säure J liefert zwei Hauptprodukte (gemäß \({}^{1}\mathrm{H}\)-NMR-Analyse), die sich durch Kieselgelchromatographie nicht trennen lassen. Ihre spektroskopischen Daten sind nahezu identisch. Im \({}^{1}\mathrm{H}\)-NMR-Spektrum lassen sich die beiden Spezies nur anhand zweier Signale mit geringfügig unterschiedlichen chemischen Verschiebungen unterscheiden.
Das \({}^{1}\mathrm{H}\)-NMR-Spektrum sieht wie folgt aus (1:1-Gemisch der Produkte K und L):
4.18–4.08 (m, 4 H), 3.95–3.60 (m, 6 H), 3.43 (dt, 2 H, \(J=7.8,\ 2.2\ \mathrm{Hz}\)),
2.55–2.25 (m, 4 H), 2.20–1.95 (m, 2 H), 1.65–1.50 (m, 2 H)Spezifische Signale für K:
1.26 (t, 3 H, \(J=7.2\ \mathrm{Hz}\)), 1.20 (d, 3 H, \(J=6.6\ \mathrm{Hz}\))
Spezifische Signale für L:
1.24 (t, 3 H, \(J=7.2\ \mathrm{Hz}\)), 1.15 (d, 3 H, \(J=6.6\ \mathrm{Hz}\))
9.5 Geben Sie die Strukturen der Produkte K und L an. Geben Sie an, in welcher Beziehung die Produkte zueinander stehen.
(a) Epimere (b) Enantiomere
(c) Diastereomere (d) Konstitutionsisomere
Die Wahl des Elektrodenmaterials kann die Selektivität einer organischen Elektrosynthese beeinflussen. Die reduktive Elektrolyse von Benzaldehyd (M) (16 mM in 1 M wässriger \(\ce{KOH}\), \(\ce{Pt}\)-Anode, −1.3 V gegen \(\ce{Ag/AgCl}\)) liefert je nach verwendetem Kathodenmaterial unterschiedliche Produkte. Eine starke Bindung an die Oberfläche begünstigt intermolekulare Reaktionen. Die folgende Abbildung zeigt die Produktverteilung für verschiedene Kathodenmaterialien und die Massenspektren der Produkte.
9.6 Geben Sie die Strukturen von N und O an.
Alkene wie Enolether lassen sich oxidativ kuppeln. Dabei wird typischerweise die Alkeneinheit anodisch zu einem Radikalkation oxidiert, das durch ein Nukleophil abgefangen werden kann.
9.7 Geben Sie die Strukturformeln von P, Q, R und S im folgenden Schema an. Die Angabe der Stereochemie ist nicht erforderlich. Hinweis: S ist ein tricyclisches Produkt.
Aufgabentext aus dem offiziellen englischen Text übersetzt.
Aufgabe 10: Schweiz — Das Land der Pharmazeutika
Pasireotid (1) ist ein peptidbasierter Arzneistoff, der vom Schweizer Pharmaunternehmen Novartis zur Behandlung des Morbus Cushing entwickelt wurde.
10.1 Bestimmen Sie die Anzahl der stereogenen Zentren (\(n\)) in Pasireotid (1). Berechnen Sie die Gesamtzahl aller möglichen Stereoisomere (\(t\)).
Pasireotid (1) ist ein cyclisches Peptid. Ein fortgeschrittenes Zwischenprodukt seiner Synthese (das lineare Peptid 2) kann mittels Festphasenpeptidsynthese (SPPS) unter Verwendung der Fmoc/tBu-Strategie hergestellt werden, wie in Schema 1 gezeigt.
Schema 1. SPPS von Peptid 2. i) Linker; ii) Harz; iii) Harzbeladung; iv) SPPS: Wiederholung von 1. Fmoc-Abspaltung 2. Aminosäurekupplung + abschließende Fmoc-Abspaltung; v) Abspaltung des Peptids vom Harz und Abspaltung von PG-2.
Die Synthese beginnt mit der Herstellung von Fmoc-Tyr(Bn)-OH (3) aus Boc-Tyr-OH (7).
10.2 Zeichnen Sie die Reagenzien A und D sowie die Zwischenprodukte B und C in der oben gezeigten Synthese von Fmoc-Tyr(Bn)-OH (3).
Die SPPS des Zwischenprodukts 2 beginnt mit der Anknüpfung von Fmoc-Tyr(Bn)-OH (3) an einen geeigneten harzgebundenen Linker.
Schema 2. ii) Harz; a) 2-Chlortritylchlorid-Linker; b) Safety-catch-Linker; c) Rink-Amid-Linker; d) SASRIN-Chlorid-Linker; e) Sieber-Amid-Linker; f) Wang-Linker
10.3 Wählen Sie aus Schema 2 den bzw. die Linker 4 aus, die für die SPPS von Peptid 2 gemäß Schema 1 geeignet sind.
10.4 Wählen Sie aus g–l die am besten geeigneten Seitenkettenschutzgruppen PG-1 und PG-2 für die SPPS von 2 gemäß Schema 1 aus, die sich in Gegenwart aller anderen in Pasireotid vorhandenen funktionellen Gruppen orthogonal abspalten lassen. Für jede Schutzgruppe ist nur eine Antwort richtig.
Anschließend wird das lineare Peptid 2 durch eine intramolekulare Kupplungsreaktion gemäß dem folgenden Schema in das cyclische Peptid 8 überführt:
Schema 3. vi) Base
10.5 Wählen Sie die richtige(n) Aussage(n) zur Cyclisierung von Peptid 2 zu 8 aus.
(a) Ein mögliches Nebenprodukt der Reaktion entsteht durch Tetramethylguanidylierung des \(N\)-terminalen Phenylalaninrests, wobei die unten gezeigte Verbindung 9 gebildet wird.
(b) Ein mögliches Nebenprodukt der Reaktion entsteht durch Abspaltung der Schutzgruppe PG-1 und Cyclisierung über die Aminogruppe des Lysinrests zur unten gezeigten Verbindung 10.
(c) Die Reaktion muss bei hoher Peptidkonzentration durchgeführt werden, um eine ausreichende Reaktionsgeschwindigkeit zu erreichen.
(d) Die Reaktion muss bei niedriger Peptidkonzentration durchgeführt werden, um eine Polykondensation zu verhindern.
(e) Das unten gezeigte Piperidin (11) ist eine geeignete Base für die Reaktion.
Die letzten Schritte der Synthese umfassen die Funktionalisierung der OH-Gruppe des 4-Hydroxyprolinrests in 8, gefolgt von der Abspaltung aller Schutzgruppen (PGs) zu Pasireotid (1).
Schema 4. vii) kann als vereinfachte Darstellung von 8 verwendet werden; viii) Abspaltung der Schutzgruppen
10.6 Zeichnen Sie die Strukturen des Zwischenprodukts E (einschließlich der Stereochemie) und des Reagenzes F. Kürzen Sie in den Strukturen E und F das Zwischenprodukt 8 als (vii) und die Schutzgruppe als PG-1 ab, wie in Schema 5 dargestellt.
10.7 Bestimmen Sie die kleinstmögliche Anzahl molarer Äquivalente der Verbindung 12, die für eine vollständige Umsetzung von 8 zu 13 erforderlich ist.
Aufgabentext aus dem offiziellen englischen Text übersetzt.
Uluslararası Kimya Olimpiyatı
IChO 2023
Zürih, İsviçre · 10 teori sorusu, tam çözümleriyle
Soru 1: Moleküler Görüntüleme
Moleküler görüntüleme, tıbbi tanıda güçlü bir araçtır. \(\ce{^{99g}Tc}\) (g = temel durum) izotopunun nükleer izomeri \(\ce{^{99m}Tc}\) (m = metastabil), radyogörüntüleme için mükemmel ışınım özelliklerine (\(\gamma\) yayıcısı, \(t_{1/2}=6.015\ \mathrm{h}\)) sahiptir. \(\ce{^{99m}Tc}\), teknesyum jeneratörü adı verilen bir düzenekte bir ana nüklidin \(\beta^-\) bozunmasıyla, \(\ce{^{99m}Tc}\)-perteknetat \(\ce{[^{99m}TcO4]^-}\) olarak elde edilir.
1.1 \(\ce{^{99m}Tc}\)'nin ana nüklidini (A) ve yayımlanan parçacığı (B) belirleyiniz.
1.2 Aşağıdaki \(\ce{^{99m}Tc}\) problarında radyoaktif metalin yükseltgenme basamaklarını belirtiniz.
Yedinci grup elementleri mangan (\(\ce{Mn}\)), teknesyum (\(\ce{Tc}\)) ve renyumun (\(\ce{Re}\)) redoks potansiyelleri, periyodik tablolardaki genel eğilimi izler (aşağıdaki Şekil 2'ye bakınız).
Şekil 2
1.3 Eksik olan iki redoks potansiyelini, i ve ii'yi hesaplayınız.
1.4 \(\ce{[MnO4]^-}\), \(\ce{[TcO4]^-}\) ve \(\ce{[ReO4]^-}\) iyonlarını karşılaştırınız. En güçlü yükseltgeni seçiniz.
1.5 Soru kâğıdındaki Şekil 2'de verilen değerlere dayanarak, asidik koşullarda \(\ce{TcO2}\)'nin \(\ce{Tc}\) ve \(\ce{TcO4^2-}\) oluşturacak şekilde disproporsiyonlaşmaya uğrayıp uğramayacağını seçiniz.
Uç konumda bir okso (\(\ce{O=}\)) veya nitrido ligandı (\(\ce{N#}\)) içeren, +V yükseltgenme basamağındaki \(\ce{Tc}\) ve \(\ce{Re}\) kompleksleri (\(d^2\) sistemleri) diyamanyetiktir. Aşağıdaki şema, üç olası moleküler orbital enerji diyagramını göstermektedir.
1.6 Gözlenen diyamanyetizmayı hangi orbital enerji diyagramının açıkladığını seçiniz. İlgili elektron dizilimini doğru diyagrama çiziniz.
\(\ce{((C4H9)4N)[^{99g}TcO4]}\) renksiz bir tozdur. Derişik \(\ce{HCl}\) eklenmesiyle, \(\ce{^{99g}Tc}\) kimyasında yaygın olarak kullanılan bu başlangıç bileşiği, yeşil renkli \(\ce{((C4H9)4N)[^{99g}TcOCl4]}\) kompleksine dönüştürülür.
1.7 İyonların veya nötr moleküllerin formüllerini kullanarak hem yükseltgenme hem de indirgenme yarı tepkimelerini ve toplam redoks tepkimesini yazınız.
Kliniklerde kullanılan tüm \(\ce{^{99m}Tc}\) radyoizleyicileri, ticari kitler kullanılarak “tek kap” tepkimeleriyle hazırlanır. Tipik olarak (\(\ce{^{99m}Tc}\) \(t_{1/2}=6.015\ \mathrm{h}\)), bir \(\ce{^{99m}Tc}\) jeneratörünün elüatı 12.5 GBq aktiviteye sahiptir (GBq = gigabekerel = saniyede \(10^9\) bozunma).
1.8 Bu tür örneklerde kaç mol \(\ce{^{99m}Tc}\) bulunduğunu hesaplayınız.
Standart görüntüleme için hastaya yaklaşık 200 MBq \(\ce{^{99m}Tc}\) uygulanır.
1.9 Vücuttan atılım yoluyla hiçbir aktivite kaybı olmadığını varsayınız. Enjekte edilen aktivitenin başlangıç aktivitesinin %1'inin altına düşmesi için hastanın kaç saat beklemesi gerektiğini hesaplayınız.
Radyoaktif metallerin biyokonjugasyonu kimyasal açıdan zorluk taşır. Yakın tarihli bir örnek, \(\ce{[^{99m}TcO3(tacn)]+}\) (A) (tacn = 1,4,7-triazasiklononan) ile alkenlerin (3 + 2) siklokatılma tepkimesidir. Bu bağlamda (3 + 2), elektron sayılarını değil, tepkimeye katılan atom sayılarını belirtir. Aşağıdaki şema, korunmuş bir karbonhidratın işaretlenmesi üzerinden bu tepkimenin bir örneğini göstermektedir.
1.10 A ve B bileşiklerinin yapılarını çiziniz. Ayrıca bu bileşiklerdeki teknesyumun yükseltgenme basamağını belirtiniz.
Soru metni resmi İngilizce metinden çevrilmiştir.
Soru 2: Elektrokimyasal CO2 İndirgenmesi
Elektrokimyasal \(\ce{CO2}\) indirgenmesi
Son yıllarda, \(\ce{CO2}\)'nin daha yüksek değerli ürünlere elektrokimyasal dönüşümü, atmosferde artan derişiminin yol açtığı olumsuz iklim etkilerini hafifletmek için umut vadeden ve teknolojik açıdan uygulanabilir bir yaklaşım olarak değerlendirilmektedir. Bu amaca ulaşmak için çeşitli teknolojiler geliştirilmiştir. Bunlar arasında, çevreye zararlı \(\ce{CO2}\)'yi temel kimyasal ham maddelere dönüştürmek için yenilenebilir enerjiyle çalışabilmesi nedeniyle, \(\ce{CO2}\)'nin elektrokimyasal yollarla indirgenmesi (\(\ce{CO2}\)RR) özellikle dikkat çekmektedir. Elektrokatalizörler, yalnızca doğası gereği yavaş olan \(\ce{CO2}\)RR'yi hızlandırmak için değil, aynı zamanda elektroliz tepkimesini istenen tepkime ürünlerine yönlendirmek için de gereklidir. Bu bağlamda, ortaya çıkan \(\ce{CO2}\)RR ürün dağılımını belirleyen yalnızca katalizörün kendi kimyasal yapısı değil, aynı zamanda çeşitli uzunluk ölçeklerindeki morfolojik özellikleridir. \(\ce{CO2}\)RR katalizör tasarımında yeni bir yaklaşım, tepkenlerin (örneğin \(\ce{H2O}\), \(\ce{H2}\) ve \(\ce{CO2}\)) erişebildiği geniş bir yüzey alanı sunan köpük tipi malzemelerin elektrokimyasal biriktirilmesine dayanır. Bakır esaslı malzemeler, \(\ce{CO2}\) elektroliziyle önemli miktarlarda hidrokarbon ve alkol üretebilen, bilinen tek metalik \(\ce{CO2}\)RR katalizörleridir.
Aşağıda seçilmiş maddelerin termodinamik verileri verilmiştir:
\(\Delta_\mathrm{f}H^\ominus\) (\(\mathrm{kJ\,mol^{-1}}\)) \(S^\ominus\) (\(\mathrm{J\,K^{-1}\,mol^{-1}}\)) \(\ce{H2O(l)}\) −285.83 69.95 \(\ce{O2(g)}\) 0 205.15 \(\ce{H2(g)}\) 0 130.68 \(\ce{CO2(g)}\) −393.52 213.79 etanol(l) −276.00 159.86 n-propanol(l) −302.54 192.80 Tablo 1. Bazı maddelerin standart koşullardaki (\(T=298.15\ \mathrm{K}\), \(p^\ominus=1\ \mathrm{bar}\)) standart oluşum entalpileri \(\Delta_\mathrm{f}H^\ominus\) ve standart entropileri \(S^\ominus\)
Hücre tepkimesi SHE'ye göre \(E^\ominus\) (V) \(\ce{Cu^2+ + 2e- = Cu}\) +0.34 \(\ce{2H+ + 2e- = H2}\) 0.00 Tablo 2. Seçilmiş yarı hücre tepkimeleri ve standart koşullardaki standart potansiyelleri
2.1 Asidik ortamda gerçekleşen şu elektrokimyasal indirgenme süreçlerinin yarı hücre tepkimelerine ait kimyasal denklemleri yazınız ve denkleştiriniz: (i) \(\ce{CO2}\)'den etanole; (ii) \(\ce{CO2}\)'den n-propanole.
2.2 İndirgenme sürecinin yarı hücresini, anot olarak işlev gören bir \(\ce{H2}/\ce{2H+}\) yarı hücresiyle birleştiriniz. \(\ce{CO2}\)'nin etanole indirgenmesi için standart hücre potansiyelini hesaplayınız.
2.3 Sırasıyla katotta ve anotta gerçekleşen tüm indirgenme ve yükseltgenme yarı hücre tepkimelerini yazınız.
Şekil 1, dinamik hidrojen kabarcıklarının şablon görevi gördüğü metal biriktirme yönteminin ilkesini göstermektedir.
Şekil 2, metal biriktirme işleminin farklı sürelerde (5 s, 20 s, 80 s) kesilmesiyle elde edilen beş farklı \(\ce{Cu}\) köpüğün üstten görünüş taramalı elektron mikroskobu görüntülerini göstermektedir.
\(\ce{Cu}\) köpük elektrokimyasal biriktirme işlemleri (bkz. Şekil 1), bakır kaynağı olarak 0.2 M bakır sülfat (\(\ce{CuSO4 * 5H2O}\)) içeren sulu 1.5 M sülfürik asit çözeltisinde gerçekleştirilmiştir. Bir \(\ce{Cu}\) disk (\(1\ \mathrm{cm^2}\)) ve bir \(\ce{Pt}\) folyo, sırasıyla katot ve anot olarak kullanılmıştır.
Şekil 1. Köpük tipi malzemelerin elektrokimyasal biriktirilmesinin gösterimi. Sulu ortamlarda yüksek akım yoğunluklarında gerçekleştirilen elektrokimyasal metal biriktirme (siyah oklar) sırasında, metalik (\(\ce{Cu}\)) destek üzerinde Hidrojen Oluşum Tepkimesi (HER) gerçekleşir (1). Böylece yüzey kısmen \(\ce{H2}\) kabarcıklarıyla kaplanır (2). \(\ce{H2}\) kabarcıkları metal biriktirme için bir şablon görevi görür (3). Sonuç olarak oldukça gözenekli bir metal köpük oluşur (4)
Şekil 2. \(j=-3\ \mathrm{A\,cm^{-2}}\) akım yoğunluğunda galvanostatik \(\ce{Cu}\) elektrokimyasal biriktirmesiyle elde edilen \(\ce{Cu}\) köpükler. Biriktirme işlemi her durumda farklı bir süre sonunda kesilmiştir: 5 s, 20 s ve 80 s. Ölçek çubuğu tüm panellerde aynıdır
2.4 Bu mekanizmayı göz önünde bulundurarak, cevap kâğıdında Şekil 2'de gösterilen \(\ce{Cu}\) köpüklere doğru biriktirme sürelerini atayınız (sol üst köşedeki beyaz kutular).
İki metalli \(\ce{CuAg}\) sistemleri, \(\ce{CO2}\)'den alkollerin elektrosentezi için mükemmel katalizörlerdir. İki metalli bir \(\ce{Cu}\)-\(\ce{Ag}\) köpük katalizörün 5.4 mg'ı (kütlece %90 \(\ce{Cu}\), \(M_{\ce{Cu}}=63.546\ \mathrm{g\,mol^{-1}}\); kütlece %10 \(\ce{Ag}\), \(M_{\ce{Ag}}=107.868\ \mathrm{g\,mol^{-1}}\)), 20 s boyunca uygulanan \(j=-3\ \mathrm{A\,cm^{-2}}\) akım yoğunluğunda bir \(\ce{Cu}\) folyo (\(1\ \mathrm{cm^2}\)) üzerine galvanostatik olarak biriktirilmiştir (eksi işareti bir indirgenme/katodik süreci ifade eder).
2.5 Bu metal biriktirme işleminin Faraday verimini (% cinsinden FE) hesaplayınız. FE, \((Q_\mathrm{product}/Q_\mathrm{total})\times100\%\) olarak tanımlanır; burada \(Q\) elektrik yükünü belirtir.
İki metalli \(\ce{Cu}\)-\(\ce{Ag}\) köpük katalizör (kütlece %90 \(\ce{Cu}\); kütlece %10 \(\ce{Ag}\)) üzerinde, \(\ce{CO2}\) ile doyurulmuş 35 mL 0.5 M \(\ce{KHCO3}\) elektrolit çözeltisinde gerçekleştirilen bir \(\ce{CO2}\) elektrolizi deneyini ele alıyoruz. \(\ce{CO2}\) elektrolizi, 3600 s boyunca sabit \(j(\mathrm{tot})=-30\ \mathrm{mA\,cm^{-2}}\) (toplam) akım yoğunluğunda gerçekleştirilmiştir (akım yoğunluğunun \(1\ \mathrm{cm^2}\) geometrik yüzey alanına göre normalize edildiğine dikkat ediniz; eksi işareti bir indirgenme/katodik süreci ifade eder). Elektrolizden sonra gerçekleştirilen ürün analizi, etanol ve n-propanol için sırasıyla \(41.3\ \mathrm{mg\,L^{-1}}\) ve \(7.4\ \mathrm{mg\,L^{-1}}\) kütle derişimleri vermiştir. Her iki alkol de sıvı tepkime ürünleridir ve elektroliz tepkimesi sırasında elektrolitte birikir. Sürecin tek yan ürünü olarak gaz hâlinde hidrojen (\(\ce{H2}\)) oluştuğunu varsayıyoruz.
2.6 Akım yoğunluklarının elektroliz süresiyle değişmediğini varsayarak, (a) etanol (\(M_\mathrm{EtOH}=46.08\ \mathrm{g\,mol^{-1}}\)) ve (b) n-propanol (\(M_\mathrm{PrOH}=60.10\ \mathrm{g\,mol^{-1}}\)) oluşumu için gereken akım yoğunluklarını hesaplayınız.
2.7 Oluşan hidrojenin ideal davrandığını ve tamamen gaz fazına geçtiğini varsayarak, \(1\ \mathrm{cm^2}\) katalizör alanında oluşan hidrojenin 298.15 K ve 1 bar'daki hacmini hesaplayınız. 2.6 numaralı soruda bir sonuç elde edemediyseniz, FE(EtOH) = 45,1 % ve FE(PrOH) = 4.8 % ile devam ediniz.
Soru metni resmi İngilizce metinden çevrilmiştir.
Soru 3: Yapay Fotosentez
Yapay fotosentez araştırmaları, güneş enerjisini kimyasal bağlarda depolamayı amaçlar. Fotonlar, duyarlılaştırıcıları uyararak soğurulur ve böylece yüklerin ayrıldığı bir durum oluşur. Uyarılmış elektron, iki kez indirgendikten sonra \(\ce{H2}\) üreten bir katalizöre (hidrojen oluşum katalizörü, HEC) aktarılır. Işığa duyarlılaştırıcı veya ışık soğurucu çoğunlukla \(\ce{[Ru(bpy)3]^2+}\) (bpy = 2,2'-bipiridin), HEC'ler ise çoğunlukla kobalt kompleksleridir.
Suyun Ayrıştırılmasının Enerjetiği
3.1 \(\ce{H2 -> 2H+(aq) + 2e-}\) tepkimesinin entalpisini hesaplayınız.
Protonun solvatasyon entalpisi: \(\Delta_{\mathrm{aq}}H(\ce{H+})=-1190\ \mathrm{kJ\,mol^{-1}}\)
Hidrojenin iyonlaşma enerjisi: \(IE_1=13.6\ \mathrm{eV}\)
\(\ce{H2}\)'nin ayrışma entalpisi: \(\Delta_{\mathrm{diss}}H(\ce{H2})=432\ \mathrm{kJ\,mol^{-1}}\)
İdeal olarak suyun elektrokimyasal yolla \(\ce{O2}\) ve \(\ce{H2}\)'ye ayrıştırılması 1.23 V gerilimde gerçekleşir. Bu süreç için \(T\Delta S\) pozitif olduğundan çevreden ısı alınması gerekir. Ek gerilim, sıcaklık düşüşünü telafi etmek için gereken ısıyı sağlıyorsa süreç termonötr olarak adlandırılır. \(\ce{H2O}\)'nun oluşum entalpisi, \(\Delta_{\mathrm f}H^\circ(\ce{H2O})\), \(-285\ \mathrm{kJ\,mol^{-1}}\)'dir.
3.2 (a) 25 °C'de 1 mol \(\ce{H2O}\)'nun ayrıştırılması tepkimesinin entropisini, \(\Delta_{\mathrm r}S^\circ\), ve (b) suyun ayrıştırılmasının termonötr olduğu gerilimi hesaplayınız.
Katalizörler
Kobalt–salen (salkomin) tipi kompleksler, proton ve elektronlardan \(\ce{H2}\) oluşumu için potansiyel katalizörlerdir. Salkominin yapısı aşağıda verilmiştir:
Şekil 1. Salkominin yapısı
3.3 Salkomindeki kobalt atomunun yükseltgenme basamağını belirleyiniz. Salkominin kobalt merkezi çevresindeki geometrik yapıyı şu üç olasılıktan birini seçerek belirleyiniz: tetrahedral, kare düzlemsel veya oktahedral.
Çözeltide salkomin, \(\ce{O2}\) bağlayabilir; \(\ce{O2}\), iki Co merkezine koordine olarak iki salkomin birimini birbirine bağlar. Bu durumda her iki Co merkezinin yükseltgenme basamağı +III olur.
3.4 Oluşan yapıyı çiziniz.
\(\ce{H2}\) oluşumu yalnızca kobalt merkezinde gerçekleşir. Tepkime, \(\ce{Co^2+}\) ile başlayan, 2 \(\ce{H+}\) ve 2 elektron kullanan 4 basamaklı bir katalitik çevrimle tanımlanır. Basamaklardan birinde, molekül içi elektron aktarımıyla bir hidrür oluşur.
3.5 Kompleksin yüklerini ve Co merkezinin yükseltgenme basamaklarını göstererek katalitik çevrimin iki olası biçimini yazınız. Co merkezinin yükseltgenme basamağı +III'ten büyük olmamalıdır. Hidrür oluşumu basamağını bir yıldız işaretiyle belirtiniz; \(\ce{H+}\) alımını C (kimyasal tepkime), elektron alımını ise E (elektrokimyasal tepkime) ile etiketleyiniz; aşağıdaki Şekil 2'de verilen örnek çevrime bakınız. \(\ce{[Co^{II}]}\), kobalt–salen kompleksini temsil eder.
Şekil 2. 3.5 sorusu için örnek bir çevrim
3.6 Tablo 1'de verilen farklı kobalt komplekslerinin redoks potansiyeli değerlerini kullanarak a) nötr pH'da suyun yükseltgenmesi b) nötr pH'da suyun indirgenmesi için hangi kompleksin uygun olduğunu yazınız. Her iki süreç için ilgili toplam tepkimeyi (yalnızca bu süreçleri gerçekleştirebilen kompleksler için) yazınız ve nötr pH'daki hücre potansiyelini hesaplayınız. pH = 7 ve \(T=298\ \mathrm K\) koşullarında protonun indirgenmesi için yarı hücre potansiyeli \(-0.41\ \mathrm V\)'tur.
Co(III/II) redoks çifti Normal hidrojen elektroduna göre \(E^\circ\) \(\ce{[Co(H2O)6]}^{3+/2+}\) \(+1.92\ \mathrm V\) \(\ce{[Co(C2O4)3]}^{3-/4-}\) \(+0.55\ \mathrm V\) \(\ce{[Co(EDTA)]}^{1-/2-}\) \(+0.38\ \mathrm V\) \(\ce{[Co(NH3)6]}^{3+/2+}\) \(+0.06\ \mathrm V\) \(\ce{[Co(en)3]}^{3+/2+}\) \(-0.18\ \mathrm V\) \(\ce{[Co(CN)5]}^{2-/3-}\) \(-0.60\ \mathrm V\) Tablo 1. 3.6 sorusu için olası redoks çiftleri; \(\ce{[C2O4]^2-}\) = oksalat, en = 1,2-etilendiamin.
Doğal Sürece Kısa Bir Bakış
Biyolojik \(\ce{H2}\) eşdeğerleri doğal olarak NADPH biçiminde depolanır; NADPH, \(\ce{NADP+}\)'ya bir hidrür iyonunun katılmasıyla üretilir. NADPH'nin yapısı Şekil 3'te gösterilmiştir.
Şekil 3. NADPH'nin yapısı
3.7 \(\ce{NADP+}\)'nın yapısını çiziniz.
Klorofilin 680 nm'deki sönüm katsayısı yaklaşık \(\varepsilon=8\times10^4\ \mathrm{M^{-1}\,cm^{-1}}\)'dir.
3.8 680 nm'de \(100\ \mathrm{nE\,s^{-1}\,cm^{-2}}\) foton akısı (1 E = 1 mol foton) için verimin (fotondan hidrojen atomuna) \(\phi=20\ \%\) olduğunu varsayarak, \(1\ \mathrm{nmol}\ (\ce{H2})\ \mathrm{s^{-1}}\) çevrim frekansı elde etmek için gereken a) saniyedeki foton sayısını ve b) \(1\times1\times1\ \mathrm{cm^3}\)'lük bir hücredeki klorofil derişimini hesaplayınız.
Soru metni resmi İngilizce metinden çevrilmiştir.
Soru 4: Florlu ve Hipervalent Bileşikler
Flor, soy gazlar \(\ce{Kr}\) ve \(\ce{Xe}\) dâhil olmak üzere hemen hemen tüm elementlerle kararlı ve izole edilebilir bileşikler oluşturur. Flor içeren moleküller sıklıkla alışılmadık yapılara sahiptir. Bu nedenle flor, 14–18. grup elementleriyle hipervalent olarak tanımlanan bileşiklerin oluşumunda sıklıkla yer alır. Günümüzde florlu organik bileşiklerin sentezi büyük ölçüde özel olarak tasarlanmış reaktiflerin bulunabilirliğine dayanır; aşağıdaki 4 bileşiği bunlara bir örnektir.
İpucu: \(\mathbf{E^1}\)–\(\mathbf{E^8}\) dizisindeki herhangi bir \(E\) elementi birden fazla kez yer alabilir.
Bölüm I. Molekül geometrisi
4.1 1, \(\mathbf{[2]^-}\) ve \(\mathbf{[3]^-}\) türlerindeki \(\mathbf{E^1}\), \(\mathbf{E^2}\), \(\mathbf{E^3}\) ve \(\mathbf{E^4}\) elementlerini belirleyin.
1: nötr, zwitteriyonik olmayan molekül, \(\mathbf{E^1}\) kare piramidal, \(\mathbf{E^2}\) oktahedral, ortalama \(d(E^1\!-\!\ce{F})=1.91\ \text{Å}\); ortalama \(d(E^2\!-\!\ce{F})=1.58\ \text{Å}\)
\(\mathbf{[2]^-}\): anyon, kare piramidal, ortalama \(d(E^3\!-\!\ce{F})=1.96\ \text{Å}\)
\(\mathbf{[3]^-}\): anyon, beşgen düzlemsel, \(d(E^4\!-\!\ce{F})=1.98\ \text{Å}\)
İpuçları:
- Molekül geometrileri, \(E^1\)–\(E^4\) atomlarına bağlanan atomların düzenlenişini ifade eder.
- 1 bileşiğinin element analizi, kütlece %17.75 karbon içeriği verir.
Grup 15 Grup 16 Grup 17 Grup 18 \(d(\ce{P-F})=1.50\text{–}1.68\ \text{Å}\) \(d(\ce{S-F})=1.52\text{–}1.60\ \text{Å}\) \(d(\ce{Cl-F})=1.63\text{–}1.85\ \text{Å}\) \(d(\ce{As-F})=1.68\text{–}1.72\ \text{Å}\) \(d(\ce{Se-F})=1.75\text{–}1.80\ \text{Å}\) \(d(\ce{Br-F})=1.77\text{–}1.97\ \text{Å}\) \(d(\ce{Kr-F})=1.77\text{–}1.89\ \text{Å}\) \(d(\ce{Sb-F})=1.85\text{–}2.05\ \text{Å}\) \(d(\ce{Te-F})=1.80\text{–}2.00\ \text{Å}\) \(d(\ce{I-F})=1.90\text{–}2.00\ \text{Å}\) \(d(\ce{Xe-F})=1.77\text{–}2.00\ \text{Å}\) Tablo 1. 15–18. gruplardan seçilmiş elementler için tipik \(\ce{E-F}\) bağ uzunluğu aralıkları
4.2 Sırasıyla hangi \(\mathbf{E^5}/\mathbf{E^6}\) ve \(\mathbf{E^7}/\mathbf{E^8}\) elementlerinin, 1 bileşiğindekilere yakın \(\ce{E-F}\) bağ uzunluklarıyla birlikte verilen geometriyi sergileyeceğini seçin (bkz. Tablo 1).
Bölüm II. Tepkimeye girme eğilimi ve yapı
Aşağıda gösterilen tepkimeyi ele alın:
4.3 \(\ce{Te}\) atomunun çevresindeki değerlik kabuğu elektron çifti bölgelerinin düzenlenişi açısından 6 bileşiğinin ideal geometrisini seçin:
- kare düzlemsel
- kare piramidal
- üçgen çift piramidal
- tetrahedral
- oktahedral
Beklenen ideal \(C^1\!-\!\ce{Te}\!-\!\ce{I}\), \(C^2\!-\!\ce{Te}\!-\!\ce{I}\), \(\ce{I-Te-O}\) ve \(C^1\!-\!\ce{Te}\!-\!C^2\) bağ açılarını verin.
4.4 Sırasıyla 4 ve 6 bileşiklerindeki iki metil grubu için beklediğiniz \({}^{1}\mathrm{H}\)-NMR sinyallerinin sayısını yazın.
4.5 6 bileşiği sırasıyla \(\ce{AgF}\) ve \(\ce{(H3C)3SiCF3}\) (\(\ce{TMSCF3}\)) ile tepkimeye girer. \(\ce{Te}\) içeren A ara ürününü ve B son ürününü doğru geometrileriyle birlikte, ayrıca C ve D yan ürünlerini formülle gösterin. A ve B'yi çizin ve C ve D yan ürünlerini yazın. İpucu: D'nin molekül kütlesi \(92.08\ \mathrm{g\,mol^{-1}}\)'dir.
6 bileşiğinin, aşağıda gösterildiği gibi, bilinen bor türevi 8 gibi sterik olarak hacimli, kiral ve enantiyomerik olarak saf bir Lewis asidiyle tepkimeye girdiğini varsayın. Bu tepkime, bileşimi 6 ve 8'in toplamına karşılık gelen yeni bir 9 ürününün oluşumuna yol açmalıdır. Ayrıca 9'un, katyonu 6'dan ve anyonu 8'den türeyen bir tuz olduğunu varsayın.
4.6 Hem \(\ce{Te}\) içeren katyonun hem de bor içeren anyonun yapısını çizin ve \(\ce{Te}\) atomunun çevresindeki değerlik kabuğu elektron çifti bölgelerinin düzenlenişi açısından katyonun ideal geometrisini seçin.
İpucu: 8 (kiral, enantiyomerik olarak saf) için aşağıdaki şematik gösterimi kullanın:
Katyonun ideal molekül geometrisini seçin:
- kare düzlemsel
- üçgen düzlemsel
- üçgen piramidal
- üçgen çift piramidal
- tetrahedral
4.7 Stereokimyasal olarak farklı olası 9 tuzlarının sayısını belirtin.
Bölüm III. Bir \(\lambda^3\)-difloroiyodanın sentezi ve bir tekli bağ etrafında dönme
10 bileşiği, aşağıda gösterildiği gibi, kuru asetonitril içinde fazla miktarda \(\ce{KF}\) varlığında başlangıç maddesi 8'in trikloroizosiyanürik asit (TCICA, 9) ile yükseltgenmesiyle hazırlanır.
4.8 Bu süreç için denkleştirilmiş yarı hücre tepkimelerini ve denkleştirilmiş toplam tepkimeyi yazın.
İpucu: 10'u \(\ce{R-I}\), 11'i \(\ce{R-IF2}\) ve TCICA'yı \(\ce{C3Cl3N3O3}\) olarak kısaltın. TCICA'nın altı üyeli halkası indirgenme sırasında bozulmadan kalır.
12'deki \(\ce{IF2}\) grubu, \(\ce{I-C}\) bağı etrafında dönebilir (moleküler bir pervane hayal edin). Bu dönmeye karşılık gelen enerji engeli deneysel olarak ölçülmüştür: \(E_\mathrm{a}=30\ \mathrm{kJ\,mol^{-1}}\). Ayrıca dönmenin hız sabiti \(228\ \mathrm{K}\)'de \(k=2500\ \mathrm{s^{-1}}\)'dir.
4.9 \(\ce{IF2}\) grubunun oda sıcaklığında (\(298\ \mathrm{K}\)) ilke olarak ne kadar hızlı dönebileceğini belirleyin. Bu süreci, hız sabitini belirlediğiniz bir kimyasal tepkimeymiş gibi ele alın. Cevabınızı cevap kâğıdına yazın. Sabitin birimi \(\mathrm{s^{-1}}\) olarak verilmelidir.
Soru metni resmi İngilizce metinden çevrilmiştir.
Soru 5: Hidrodesülfürizasyon
Çevre için toksik olan kükürt içeren bileşiklerin emisyonunu azaltmaya yönelik genel eğilim, kükürtsüz yakıtların üretilmesidir. Kükürdü uzaklaştırmak için rafinerilerde hidrojen destekli hidrodesülfürizasyon işlemi kullanılır.
5.1 A ve B'nin halkalı bölge izomerleri ve C'nin halkalı olduğunu bilerek, tiyofenin hidrodesülfürizasyon ürünleri A–E'nin yapılarını çiziniz.
Şekil 1. Tiyofenin hidrodesülfürizasyon işlemi
Kükürdün doğada en yaygın bulunan iki kararlı izotopu \(\ce{^{32}S}\) ve \(\ce{^{34}S}\) olup bağıl molar bollukları sırasıyla \(x(\ce{^{32}S})=94.8\,\%\) ve \(x(\ce{^{34}S})=4.37\,\%\)'tir. Hidrojenin doğada bulunan kararlı izotopları \(\ce{^{1}H}\) ve \(\ce{^{2}H}\) (\(\ce{D}\)) olup bağıl molar bollukları sırasıyla \(x(\ce{^{1}H})=99.986\,\%\) ve \(x(\ce{^{2}H})=0.014\,\%\)'tür.
5.2 Yalnızca yukarıda listelenen izotopları dikkate alarak, \(\ce{H2S}\)'nin tüm izotopologlarını listeleyiniz.
5.3 Yalnızca yukarıda listelenen izotopları dikkate alarak, aynı anda hem \(\ce{D}\) hem de \(\ce{^{34}S}\) çekirdekleri içeren tüm \(\ce{H2S}\) izotopologlarını listeleyiniz ve her birinin bağıl molar bolluğunu % cinsinden hesaplayınız.
Desülfürizasyon, genellikle \(\ce{SiO2}\) üzerinde desteklenmiş \(\ce{MoS2}\) (\(\ce{MoS2}/\ce{SiO2}\)) katalizörü üzerinde gerçekleştirilen katalitik bir işlemdir. Katalizörün yüzeyini incelemek için izotop değişimi yöntemleri kullanılabilir. İzotop değişim tepkimesi gaz-katı ara yüzeyinde gerçekleşir ve yalnızca yüzey atomlarının değişimiyle sonuçlanır. İlk yaklaşımda, iç kısımdaki atomlar değişime katılmaz (Şekil 2).
Deneyde, \(\ce{MoS2}/\ce{SiO2}\) katalizörü (Mo kütle kesri \(w_{\mathrm{Mo}}=4.280\,\%\), başlangıçta yalnızca \(\ce{^{32}S}\) içeren) ile gaz hâlindeki izotopla işaretlenmiş \(\ce{H2^{34}S}\) arasındaki izotop değişimi bir akış reaktöründe incelenmiştir (Şekil 2). \(\ce{MoS2}/\ce{SiO2}\) katalizörü (\(m_{\mathrm{cat}}=1.2350\,\mathrm{g}\)), \(\ce{H2^{34}S}\) içeren ve geri kalanı \(\ce{Ar}\) olan bir gaz karışımı (hacim kesri \(\varphi(\ce{H2^{34}S})=1.00\,\%\), \(\ce{^{34}S}\) izotop saflığı \(\alpha=99.95\ \text{mol.}\,\%\)) akışı altında (\(p=1.00\,\mathrm{bar}\), \(v=20.0\,\mathrm{mL\,min^{-1}}\), \(T=23.0\,^\circ\mathrm{C}\)) tutulmuştur. Deney süresi \(t=10.0\,\mathrm{min}\) olup çıkış gazı deneyin tamamı boyunca toplanmıştır. Toplanan gaz fazındaki kükürt atomları arasında \(\ce{^{34}S}\) izotopunun ölçülen kesri (\(\gamma\)), \(\gamma=87.3\ \text{mol.}\,\%\) olarak bulunmuştur. Gazın ideal davrandığını, yüzeydeki ve iç kısımdaki \(\ce{MoS2}\)'nin elementel (izotopik değil!) bileşimlerinin aynı olduğunu ve deneyin sonunda yüzeydeki tüm kükürt atomlarının gaz fazıyla değişime uğradığını varsayınız.
Şekil 2. Deneyin devam ederken (A) ve son aşamadaki (B) şematik gösterimi. Yüzeydeki kükürt atomları kırmızı, iç kısımdaki kükürt atomları mavi renkle gösterilmiştir. Molibden atomları gösterilmemiştir.
5.4 Değişime uğrayan kükürt atomlarının miktarını \(n(\ce{S})_{\mathrm{surface}}\) mol cinsinden hesaplayınız.
Değişime uğrayan kükürt atomlarının miktarını hesaplayamadıysanız, bundan sonraki tüm hesaplamalarda \(1.53\times10^{-5}\,\mathrm{mol}\) değerini kullanınız.
\(\ce{MoS2}\) fazının eş boyutlu küresel taneciklerden oluştuğunu ve deney sonunda yüzeyde bulunan tüm kükürt atomlarının değişime uğradığını, iç kısımdaki atomların ise değişim tepkimesine katılmadığını varsayınız. \(\ce{MoS2}\)'nin yoğunluğu \(\rho=5.06\,\mathrm{g\,cm^{-3}}\), yüzeydeki \(\ce{S}\) ve \(\ce{Mo}\) atomlarının kapladığı ortalama alanlar sırasıyla \(A_{\mathrm{S}}=3.00\times10^{-19}\,\mathrm{m^2}\) ve \(A_{\mathrm{Mo}}=5.00\times10^{-19}\,\mathrm{m^2}\)'dir. Yarıçapı \(R\) olan bir kürenin yüzey alanı \(S=4\pi R^2\), hacmi ise \(V=(4/3)\pi R^3\) ile hesaplanabilir. İzotopik bileşimin \(\ce{MoS2}\)'nin yoğunluğunu etkilemediğini varsayınız.
5.5 \(\ce{MoS2}\) taneciklerinin yarıçapını \(R\) hesaplayınız. Yanıtınızı nm cinsinden veriniz.
Gerçekte, yüzeydeki izotopla işaretlenmiş atomlar iç kısma difüzlenirken, iç kısımdaki işaretlenmemiş atomlar yüzeye ilerleyerek kademeli bir değişime uğrar (Şekil 3A). Dolayısıyla, belirli bir anda tanecik içindeki işaretlenmiş atomların kesri, taneciğin yüzeyinden merkezine doğru azalır. Aynı zamanda, değişim süresi uzadıkça iç kısımdaki atomların değişim tepkimesine katılımı Şekil 3B'de şematik olarak gösterildiği gibi artar.
Şekil 3. A) Bir \(\ce{MoS2}\) taneciğinde kükürt izotoplarının yüzeyden iç kısma difüzyonunun şematik gösterimi. Yüzeydeki kükürt atomları kırmızı, iç kısımdaki kükürt atomları mavi renkle gösterilmiştir. Molibden atomları gösterilmemiştir. B) Zamanın ve tanecik merkezinden uzaklığın fonksiyonu olarak iç kısımdaki \(\ce{^{34}S}\) atomlarının kesri; \(r_{\mathrm{edge}}\), \(\ce{MoS2}\) taneciğinin yarıçapına karşılık gelir.
Deney sonunda yüzey atomlarının tamamı değişime uğrar ve buna ek olarak iç kısmın bir bölümü de difüzyon yoluyla değişime uğrar. İç kısımda değişime uğrayan kükürt atomlarının miktarının, \(n(\ce{S})_{\mathrm{bulk}}^{\mathrm{ex}}\), iç kısımdaki toplam kükürt atomlarının miktarına, \(n(\ce{S})_{\mathrm{bulk}}^{\mathrm{total}}\), oranı şu şekilde hesaplanabilir:
\[ F=n(\ce{S})_{\mathrm{bulk}}^{\mathrm{ex}}/ n(\ce{S})_{\mathrm{bulk}}^{\mathrm{total}} =1-\exp(-Dt/R^2) \]
Burada \(t\), yukarıda açıklanan değişim deneyinin süresi, \(R\) tanecik yarıçapı ve \(D\) difüzyon katsayısıdır. Yukarıda açıklanan katalizör, elektron mikroskopisiyle bağımsız olarak incelenmiş ve \(\ce{MoS2}\) taneciklerinin yarıçapı \(35.0\,\mathrm{nm}\) olan, düzgün dağılım gösteren küreler olduğu belirlenmiştir.
5.6 \(R=35.0\,\mathrm{nm}\) değerini ve yukarıda açıklanan değişim deneyinin verilerini kullanarak, kükürt atomlarının \(\ce{MoS2}\) içindeki difüzyonu için difüzyon katsayısını \(D\) (\(\mathrm{m^2\,s^{-1}}\) cinsinden) hesaplayınız. Hesaplamalarınızda \(e^x\approx1+x\) yaklaşımını \(x\ll1\) için kullanınız.
Soru metni resmi İngilizce metinden çevrilmiştir.
Soru 6: Metanın Doğrudan Metanole Dönüştürülmesi
Metan, doğal gaz olarak yaygın biçimde bulunur; bu da onu kimya endüstrisi için, örneğin metanol üretiminde, cazip bir ham madde hâline getirir. Ancak metanol metandan daha kolay yükseltgendiği için bu sürecin kontrolü zordur. Aşırı yükseltgenme, bakır iyonlarıyla değiştirilmiş zeolit katalizörlerin aktif merkezlerinin metanole yükseltgenme için gereken tek oksijen atomunu sağladığı ve tüketildiği bir kimyasal döngü süreciyle önlenir. İkinci bir adımda katalizör, metan bulunmayan ortamda oksijenle yenilenir. Aşağıdaki şema, olası iki katalitik bakır merkezini göstermektedir. Tepkime sırasında Cu(II), Cu(I)'e indirgenir.
6.1 Bir metan molekülünü metanole yükseltgemek için gereken S1 merkezlerinin sayısını ve S2 merkezlerinin sayısını veriniz.
Oksijen yokluğunda oluşan metanol zeolitten desorbe olmaz. Tepkime, hacmi ve sıcaklığı sabit bir kapta (otoklavda) gerçekleştirilirse basınç düşüşü yalnızca ideal gaz olarak kabul edilebilen metanın tüketiminden kaynaklanır. Kütlece % 4.3 bakır yüklenmiş 200 mg zeolit içeren 1 L'lik bir otoklavda, başlangıçtaki metan basıncı \(p_0 = 933\ \mathrm{Pa}\), 528 K'de tepkimenin tamamlanmasının ardından \(p_\infty = 925\ \mathrm{Pa}\) değerine düşmüştür.
6.2 Bakırın yüzde kaçının tepkimeye girdiğini hesaplayınız.
6.3 Deneysel veriler Şekil 1'de grafik olarak verilmiştir. Buna dayanarak \(\ce{CH4}\)'ün yükseltgenmesinin (yalancı) derecesini belirleyiniz.
(a) Tepkime (yalancı) sıfırıncı derecedendir.
(b) Tepkime (yalancı) birinci derecedendir.
(c) Tepkime (yalancı) ikinci derecedendir.
Şekil 1. Bir otoklavda çeşitli sıcaklıklarda, S1 ve S2 merkezlerini içeren bakır yüklenmiş zeolitle gerçekleşen tepkime için normalize edilmiş metan basıncının zamana karşı yarı logaritmik grafiği. Semboller deneysel veri noktalarını göstermektedir. Düz çizgiler, uygun zaman aralıklarına yapılan doğrusal uyumları göstermektedir. Noktalı çizgiler görsel kılavuz niteliğindedir
6.4 Verilen koşullarda deneysel verilerle uyumlu olan, \(\ce{CH4}\)'ün yükseltgenmesine ilişkin (yalancı) hız yasasını yazınız. Bu yasanın \(\ce{CH4}\) derişiminin yanı sıra S1 ve S2 merkezlerinin derişimlerine ve hız sabitlerine de bağlı olabileceğini dikkate alınız.
6.5 Doğru ifade veya ifadeleri seçiniz.
(a) Her biri farklı bir hız sabitine sahip en az iki tür bakır merkezi tepkimeye girer.
(b) Zeolit tarafından gerçekleştirilen toplam metan yükseltgenmesi daha yüksek sıcaklıkta daha hızlıdır.
(c) Daha yüksek sıcaklıkta, tepkime tamamlandığında bakır merkezlerinin daha büyük bir kısmı metanla tepkimeye girmiş olur.
(d) Tepkimelerden biri daha yüksek sıcaklıkta yavaşlar.
Paramanyetik S1 merkezleri elektron paramanyetik rezonans (EPR) spektroskopisiyle gözlenebilirken, diyamanyetik S2 merkezleri EPR sinyali vermez. EPR spektroskopisi elektron spinlerinin sayısını ölçer. Dolayısıyla S1 merkezlerinin sayısı, EPR spektrumunun çift integrali \(I_2\) ile orantılıdır; yani \([\mathbf{S1}] \propto I_2\). Spektrumlar farklı \(T\) sıcaklıklarında ve her sıcaklıkta tepkimenin başlatılmasından sonraki farklı \(t\) zamanlarında ölçülmüştür.
6.6 \(I_2(t)\) ile S1 merkezlerinin kaybolmasına ilişkin hız sabiti arasında ilişki kuran, zamana göre doğrusal denklemi türetiniz.
6.7 Bilinen bir Cu(II) standardıyla kalibre edilmesi gereken her ölçüm için cevap kâğıdındaki kutuları işaretleyiniz.
(a) Numunedeki paramanyetik Cu(II) merkezlerinin toplam sayısı.
(b) Numunedeki paramanyetik Cu(II) merkezlerinin derişimi.
(c) Hız sabiti.
(d) Numunedeki farklı paramanyetik Cu(II) türlerinin çeşitleri.
EPR ölçümlerinden, 528 K'de S1 merkezleriyle gerçekleşen tepkimenin hız sabitinin \(2.604 \times 10^{-3}\ \mathrm{s^{-1}}\) olduğu bilinmektedir.
6.8 Şekil 1'i dikkate alarak ve bir hesaplamaya dayanarak, metanın S2 merkezleriyle S1 merkezlerine kıyasla daha hızlı mı yoksa daha yavaş mı tepkimeye girdiğini belirleyiniz.
(a) Metan S1 ile daha hızlı tepkimeye girer.
(b) Her iki tepkime hızı da aynıdır.
(c) Metan S2 ile daha hızlı tepkimeye girer.
Metanol, farklı zeolit katalizörlerle daha sonra değerli olefinlere dönüştürülebilir. Bu süreçte molar kütlesi \(86.09\ \mathrm{g\,mol^{-1}}\) olan, element analizi sonuçları kütlece % 55.8 \(\ce{C}\) ve % 7.0 \(\ce{H}\) olan ve \({}^{1}\mathrm{H}\) NMR spektrumu dört farklı kimyasal kaymada sinyallerden oluşan bir ara ürün gözlenir:
a: 12.2 ppm (1H, s), geniş, \(\ce{D2O}\) eklendiğinde kaybolur
b: 6.3 ppm (1H, d)
c: 5.7 ppm (1H, d)
d: 2.0 ppm (3H, s)
6.9 Ara ürünün yapısını çiziniz ve a ile d protonlarının atamalarını yapınız.
Amerika Birleşik Devletleri Enerji Bakanlığı, yalnızca \(\ce{C}\), \(\ce{H}\) ve \(\ce{O}\) içeren on iki kimyasal bileşiği platform kimyasalları olarak belirlemiştir. Bunlar, yenilenebilir kaynaklardan kolayca hazırlanabilen ve kendilerinden çok sayıda hedef türev hazırlanabilen, en umut verici adaylardır. Bunlardan biri, daha ileri türevlendirme işlemlerine tabi tutulabilen veya örneğin tıbbi uygulamalarda ya da deterjanlarda kullanılabilen A bileşiğidir.
- DMSO içinde \({}^{1}\mathrm{H}\) NMR: 7.81 ppm (a, s), 13.0 ppm (b, s, geniş, \(\ce{D2O}\) eklendiğinde kaybolur); her iki sinyalin integrali aynıdır.
- \({}^{13}\mathrm{C}\) NMR: 165.1 ppm (1), 150.6 ppm (2) ve 120.6 ppm (3).
- \(M = 156.03\ \mathrm{g\,mol^{-1}}\). Element analizi: kütlece % 46.15 \(\ce{C}\), % 2.56 \(\ce{H}\).
6.10 A için olası bir yapı veriniz ve tüm protonların ve 1 karbonunun atamalarını yapınız.
Soru metni resmi İngilizce metinden çevrilmiştir.
Soru 7: Enzim Kinetiği
1913 yılında ortaya konan Michaelis–Menten (MM) mekanizması, enzim katalizinin kinetiğini açıklar. Bu mekanizmada \(\ce{E}\) enzimi, \(\ce{S}\) substratının \(\ce{P}\) ürününe dönüşümünü katalizler:
MM mekanizmasına uyan bir enzimatik tepkimenin başlangıç hızı şu şekilde verilir:
\[ v_0=v_{\max}\frac{[\ce{S}]_0}{K_{\mathrm M}+[\ce{S}]_0} \tag{1} \]
Bu ifade, \(\ce{E}\)'nin başlangıç derişimi \(\ce{S}\)'nin başlangıç derişiminden çok düşük olduğunda, \([\ce{E}]_0\ll[\ce{S}]_0\), geçerlidir. Michaelis sabiti \(K_{\mathrm M}=(k_2+k_3)/k_1\) olarak tanımlanır. Başlangıç hızı, bağıl akış \(j\) ile \([\ce{E}]_0\)'ın çarpımı olarak da ifade edilebilir:
\[ v_0=j[\ce{E}]_0 \tag{2} \]
Not: 7.1 ve 7.2 sorularında bir veya birden fazla doğru seçenek olabilir ya da hiçbir seçenek doğru olmayabilir.
7.1 Başlangıç hızını (\(v_0\)) veren (1) ve (2) ifadelerinin doğru alternatif biçimlerini seçiniz.
\([\ce{ES}]_{\max}\), \(\ce{ES}\) kompleksinin maksimum derişimidir.
- (a) \(\displaystyle v_0=\frac{k_3[\ce{E}]_0[\ce{S}]_0}{K_{\mathrm M}+[\ce{S}]_0}\)
- (b) \(\displaystyle v_0=\frac{k_3[\ce{E}]}{K_{\mathrm M}/[\ce{S}]_0+1}\)
- (c) \(\displaystyle v_0=j[\ce{ES}]_{\max}\)
- (d) \(\displaystyle v_0=\frac{k_3[\ce{E}]_0[\ce{ES}]_{\max}}{K_{\mathrm M}+[\ce{S}]_0}\)
- (e) \(\displaystyle v_0=\frac{k_3[\ce{E}]_0}{K_{\mathrm M}/[\ce{S}]_0+1}\)
- (f) \(\displaystyle v_0=\frac{j[\ce{E}]_0}{K_{\mathrm M}+[\ce{S}]_0}\)
7.2 Doğrusal bir grafik vermesi beklenen eksen çiftlerini (\(y\)'nin \(x\)'e karşı grafiği) seçiniz.
- (a) \(v_0\)'ın \(1/[\ce{S}]_0\)'a karşı grafiği
- (b) \(v_0\)'ın \(v_0/K_{\mathrm M}\)'ye karşı grafiği
- (c) \(v_0\)'ın \(K_{\mathrm M}/v_0\)'a karşı grafiği
- (d) \(1/v_0\)'ın \(v_0/[\ce{S}]_0\)'a karşı grafiği
- (e) \(1/v_0\)'ın \(v_0/K_{\mathrm M}\)'ye karşı grafiği
- (f) \([\ce{S}]_0/v_0\)'ın \([\ce{S}]_0\)'a karşı grafiği
Birçok enzim, tek substratlı dönüşümler yerine çok substratlı dönüşümleri katalizler. Ancak substratlardan birinin derişimi diğer substratın derişiminden çok yüksekse veya sabit tutuluyorsa MM kinetiği yine geçerlidir. Burada MM kinetiğine uyan iki bağımsız enzimatik sistemi inceleyeceğiz.
Enzimatik Sistem I
\(\ce{E}\) enzimi, \(\ce{A}\) ve \(\ce{B}\) substratlarını \(\ce{P_A}\) ve \(\ce{P_B}\) ürünlerine dönüştürür. Serbest enzim ile tüm enzim–substrat kompleksleri arasında hızlı bir ön denge kurulduğunda aşağıdaki denklem geçerlidir:
\[ v_0= \frac{k[\ce{E}]_0[\ce{A}]_0[\ce{B}]_0} {(K+[\ce{A}]_0)(K+[\ce{B}]_0)} \tag{3} \]
Burada \(k\), tepkimelerden birinin hız sabitidir. Her iki substratın da \(\ce{E}\)'nin kendisine karşılık gelen aktif bölgesinden ayrışması aynı \(K\) denge sabitiyle tanımlanır.
7.3 \(\ce{B}\) substratının derişimi sabit bir \(c_0\) değerinde tutulduğunda (3) denkleminin (1) numaralı MM biçimini aldığını gösteriniz. Bu durum için \(v_{\max}\) ifadesini veriniz.
7.4 Enzimatik Sistem I için (3) denklemiyle uyumlu, tüm ara türleri ve ürünleri gösteren bir kinetik şema öneriniz. Hız sabiti \(k\) olan tepkimeyi belirtiniz.
Enzimatik Sistem II
\(\ce{E}\) enziminin, her biri sırasıyla seçici olarak \(\ce{P_A}\), \(\ce{P_B}\) veya \(\ce{P_C}\) ürünlerine dönüştürülen \(\ce{S_A}\), \(\ce{S_B}\) veya \(\ce{S_C}\) substratlarından birine özgü beş aktif bölgesi vardır. Her substrat için en az bir aktif bölge bulunur. Her aktif bölge diğerlerinden bağımsızdır.
\(\ce{E}\) için şunlar bilinmektedir:
-
\(\ce{S_C}\)'ye olan afinite, \(\ce{S_B}\)'ye olan afiniteden yüksektir.
-
\(\ce{S_A}\), \(\ce{S_B}\), \(\ce{S_C}\) için, hızın aktif bölge başına (\(v_{0i}\)) verildiği ve Eadie–Hofstee grafiği olarak bilinen, \(v_{0i}\)'nin \(v_{0i}/[\ce{S_i}]_0\)'a karşı grafiği aşağıda gösterilmiştir; ancak ölçek ve açıklama anahtarı çıkarılmıştır.
-
\(\ce{E}\), \(\ce{S_A}\), \(\ce{S_B}\), \(\ce{S_C}\) ile doyurulduğunda, \(\ce{S_C}\) için bölge başına katalitik çevrim sayısı (TON) \(10200\ \mathrm{min^{-1}}\) olur ve saniyede toplam 2023 adet \(\ce{P_A}\), \(\ce{P_B}\), \(\ce{P_C}\) ürün molekülü sentezlenir. Aynı zamanda, saatte en fazla \(5.94\times10^6\) adet \(\ce{P_A}\) ve \(\ce{P_B}\) molekülünün oluştuğu saptanır.
-
\(\ce{S_A}\), \(\ce{S_B}\), \(\ce{S_C}\)'nin eşit molar derişimlerde olduğu ve bu derişimlerin ilgili \(K_{\mathrm M,i}\) değerlerinden en az 1000 kat düşük olduğu durumda, \(\ce{P_A}\), \(\ce{P_B}\), \(\ce{P_C}\) derişimleri katalitik verimlilikle \((\varepsilon_i=k_{i3}/K_{\mathrm M,i})\) orantılı hâle gelir ve bunların oranı sırasıyla \(3:2:5\) olur.
-
İki \(\ce{ES_i}\) kompleksinin \(\ce{E}\) ve \(\ce{S_i}\)'ye ayrışma hız sabitleri eşittir. \(\ce{ES_C}\)'nin başlangıç bileşiklerine dönüştüğü tepkimenin aktivasyon engeli, son ürünlere dönüştüğü tepkimeninkinden \(1266\ \mathrm{J\,mol^{-1}}\) daha yüksektir. Her iki tepkimenin üstel öncesi çarpanlarının eşit olduğunu ve \(T=25\,^\circ\mathrm C\) olduğunu varsayınız.
-
\(\ce{E + S_i}\) tepkimesi için: \(k_{\mathrm{c1}}=1.57\times10^7\ \mathrm{M^{-1}\,s^{-1}}\) ve \(k_{\mathrm{a1}}=k_{\mathrm{b1}}\).
7.5 Aşağıdaki tabloyu doldurunuz ve hesaplamalarınızı gösteriniz. İpuçları:
- \(K_{\mathrm M,A}\), \(K_{\mathrm M,B}\) ve \(K_{\mathrm M,C}\) sabitleri arasındaki ilişkiyi (\(<\), \(>\), \(=\)) bulmak için 1. ve 2. maddelerdeki bilgileri kullanınız.
-
- ve 5. maddelerdeki bilgiler, tablonun ilk sütununu (her substrat için aktif bölge sayısı) ve son satırını (\(\ce{S_C}\) substratına ait tüm sabitler) tamamlamanızı sağlar. Aktif bölgelerin toplam sayısının 5 olduğunu kontrol ediniz.
Aktif bölge sayısı \(k_1\) \(k_2\) \(k_3\) \(K_{\mathrm M}\) \(\ce{S_A}\) \(\ce{S_B}\) \(\ce{S_C}\) \(1.57\times10^7\ \mathrm{M^{-1}\,s^{-1}}\) Soru metni resmi İngilizce metinden çevrilmiştir.
Soru 8: Nazarov Tepkimesi
Nazarov tepkimesi, divinil ketonlardan siklopentenonların elde edilmesinde sıkça kullanılan bir tepkimedir. Fotokimyasal olarak veya asit kataliziyle gerçekleşir ve ardından proton aktarımının geldiği bir elektrohalkalaşmadır.
8.1 Nazarov tepkimesini açıklamak için π molekül orbitallerini çiziniz. Elektronları ilgili enerji düzeylerine yerleştiriniz. (i) HOMO'yu (en yüksek enerjili dolu molekül orbitali) ve (ii) LUMO'yu (en düşük enerjili boş molekül orbitali) x ile işaretleyiniz. Bu alıştırmada divinil ketonu, beş p orbitali içeren bir pentadienil katyonu olarak ele alabilirsiniz.
8.2 8.1 görevinde elde ettiğiniz π molekül orbitallerinden hareketle, divinil ketonun Nazarov tepkimesinin hangi koşullarda disrotator veya konrotator biçimde gerçekleşeceğini öngörünüz. Tepkimenin izinli olduğu koşulları tabloda x ile işaretleyiniz.
Disrotator Konrotator Termal Fotokimyasal 8.3 Nazarov tepkimesi, farnesin sentezinde kilit tepkime olarak kullanılmıştır. Aşağıdaki her iki koşul için, A ve B'nin her birinin stereokimyasını da göstererek olası birer yapısını çiziniz. Her iki tepkimenin ürünlerinin de \(\ce{^1H}\) NMR spektrumunda 6.70–6.73 ppm'de bir sinyal verdiğine dikkat ediniz.
Kapnellen sentezi, aşağıda gösterilen doymamış aldehit C ile başlar. D ile muamelenin ardından karbon üzerine desteklenmiş \(\ce{MnO2}\) ile tepkimeye sokulması, aşağıda gösterilen divinil keton E'yi vermiştir. \(\ce{P2O5}\) ve MsOH karışımıyla muamele, bir dizi tepkimeyle doymamış keton I'ya dönüştürülen F'yi vermiştir.
8.4 Listeden D olarak kullanılmaya uygun reaktif(ler)i seçiniz.
(a) \(\ce{H2C=CHMgBr}\) (c) \(\ce{H2C=CHBr}\), \(\ce{Pd(PPh3)4}\)
(b) 1. \(\ce{NaBH4}\) 2. \(\ce{H2C=CHLi}\) (d) \(\ce{H2C=CHMgBr}\), \(\ce{CuI}\)
8.5 F, G ve H ara ürünlerinin yapılarını stereokimyalarıyla birlikte veriniz.
Ardından enon I, THF içinde \(\ce{H2C=CHMgBr}\) ve \(\ce{CuI}\) ile tepkimeye sokularak J ara ürünü elde edilmiş; bunu izleyen ozonoliz ile \(\ce{^1H}\) NMR spektrumunda 9.61 ppm'de sinyal veren K ara ürünü oluşmuştur. THF ve eter karışımı içinde %5'lik \(\ce{KOH}\) ile muamele, L ara ürününü vermiştir. Pt katalizörüyle ve \(\ce{H2}\) atmosferi altında hidrojenleme sonucunda, sonunda kapnellenin elde edildiği M oluşmuştur.
8.6 J, K, L ve M yapılarını stereokimyalarıyla birlikte veriniz.
Soru metni resmi İngilizce metinden çevrilmiştir.
Soru 9: Organik Sentezde Elektroliz
Kolbe elektrolizi, iki karboksilik asidin dekarboksilatif dimerleşmesini tanımlar ve yalnızca asit deprotonlandığında gerçekleşir. Denkleştirilmemiş tepkime denklemi aşağıda gösterilmiştir.
Tepkime sırasında iki gaz (B ve C) oluşur. B, \(\ce{Ca(OH)2}\) ile tepkimeye girerken C son derece yanıcıdır.
9.1 A, B ve C'nin yapı formüllerini veriniz.
9.2 Sentez, biçimsel olarak karboksilatın yükseltgendiği ve çözücünün indirgendiği bir redoks tepkimesidir. Yükseltgenme ve indirgenme yarı tepkimelerini ve toplam redoks tepkimesini yazınız.
9.3 Yükseltgen dekarboksilasyon ve ürün oluşumu mekanizmasındaki 1 ve 2 ara türlerini veriniz.
Kolbe elektrolizi genellikle yalnızca uzun zincirli doymuş karboksilik asitler için verimlidir; D gibi bazı karboksilik asitler için ise verimli değildir. Burada, radikal ara tür E'nin pozitif yüklü bir F türüne ileri yükseltgenmesi kolaylaşır. Ara tür F, nükleofillerle tepkimeye girerek farklı yan ürünler oluşturabilir; örneğin D ile tepkimeye girerek G esterini, \(\ce{MeOH}\) ile tepkimeye girerek H'yi oluşturur.
9.4 D–H'nin yapılarını veriniz.
Karboksilik asit I'nın, birlikte kullanılan J asidinin fazlası varlığında elektrolizi, silika jel kromatografisiyle birbirinden ayrılamayan iki ana ürün verir (\({}^{1}\mathrm{H}\) NMR analizine göre). Bu ürünlerin spektroskopik verileri neredeyse aynıdır. \({}^{1}\mathrm{H}\) NMR spektrumunda iki tür, yalnızca kimyasal kaymaları arasında küçük farklar bulunan iki sinyal sayesinde ayırt edilebilir.
\({}^{1}\mathrm{H}\) NMR spektrumu aşağıdaki gibidir (K ve L ürünlerinin 1:1 karışımı):
4.18–4.08 (m, 4 H), 3.95–3.60 (m, 6 H), 3.43 (dt, 2 H, \(J=7.8,\ 2.2\ \mathrm{Hz}\)),
2.55–2.25 (m, 4 H), 2.20–1.95 (m, 2 H), 1.65–1.50 (m, 2 H)K'ye özgü sinyaller:
1.26 (t, 3 H, \(J=7.2\ \mathrm{Hz}\)), 1.20 (d, 3 H, \(J=6.6\ \mathrm{Hz}\))
L'ye özgü sinyaller:
1.24 (t, 3 H, \(J=7.2\ \mathrm{Hz}\)), 1.15 (d, 3 H, \(J=6.6\ \mathrm{Hz}\))
9.5 K ve L ürünlerinin yapılarını veriniz. Ürünler arasındaki ilişkiyi belirtiniz.
(a) Epimerler (b) Enantiyomerler
(c) Diastereomerler (d) Yapı izomerleri
Elektrot malzemesinin seçimi, organik bir elektrosentetik tepkimenin seçiciliğini etkileyebilir. Benzaldehidin (M) indirgen elektrolizi (1 M sulu \(\ce{KOH}\) içinde 16 mM, \(\ce{Pt}\) anot, \(\ce{Ag/AgCl}\)'ye göre −1.3 V), kullanılan katot malzemesine bağlı olarak farklı ürünler verir. Yüzeye kuvvetli bağlanma, moleküller arası tepkimeleri destekler. Aşağıdaki şekil, farklı katot malzemeleri için ürün dağılımını ve ürünlerin kütle spektrumlarını göstermektedir.
9.6 N ve O'nun yapılarını veriniz.
Enol eterler gibi alkenler, yükseltgen eşleşme tepkimesi verebilir. Bu süreç tipik olarak alken biriminin anodik yükseltgenmesiyle, bir nükleofil tarafından yakalanabilen bir radikal katyon oluşumunu içerir.
9.7 Aşağıdaki şemada yer alan P, Q, R ve S'nin yapı formüllerini veriniz. Stereokimyanın belirtilmesi gerekli değildir. İpucu: S, trisiklik bir üründür.
Soru metni resmi İngilizce metinden çevrilmiştir.
Soru 10: İsviçre — İlaçlar Ülkesi
Pasireotid (1), İsviçreli ilaç şirketi Novartis tarafından Cushing hastalığının tedavisi için geliştirilmiş peptit temelli bir ilaçtır.
10.1 Pasireotiddeki (1) stereojenik merkezlerin sayısını (\(n\)) belirleyiniz. Olası tüm stereoizomerlerin toplam sayısını (\(t\)) hesaplayınız.
Pasireotid (1) halkalı bir peptittir. Sentezinin ileri bir aşamasındaki bir ara ürün (doğrusal peptit 2), Şema 1'de gösterildiği gibi Fmoc/tBu stratejisi kullanılarak katı faz peptit sentezi (SPPS) ile hazırlanabilir.
Şema 1. Peptit 2'nin SPPS ile sentezi. i) Bağlayıcı; ii) Reçine; iii) Reçineye yükleme; iv) SPPS: 1. Fmoc koruma grubunun uzaklaştırılması 2. amino asit kenetlenmesi adımlarının tekrarlanması + son Fmoc koruma grubunun uzaklaştırılması; v) Peptidin reçineden ayrılması ve PG-2 koruma grubunun uzaklaştırılması.
Sentez, Boc-Tyr-OH'den (7) Fmoc-Tyr(Bn)-OH (3) hazırlanmasıyla başlar.
10.2 Yukarıda gösterilen Fmoc-Tyr(Bn)-OH (3) sentezindeki A ve D reaktifleri ile B ve C ara ürünlerini çiziniz.
Ara ürün 2'nin SPPS ile sentezi, Fmoc-Tyr(Bn)-OH'nin (3) reçineye bağlı uygun bir bağlayıcıya bağlanmasıyla başlar.
Şema 2. ii) Reçine; a) 2-Klorotritil klorür bağlayıcısı; b) Safety-catch bağlayıcısı; c) Rink amid bağlayıcısı; d) SASRIN klorür bağlayıcısı; e) Sieber amid bağlayıcısı; f) Wang bağlayıcısı
10.3 Şema 2'den, peptit 2'nin Şema 1'e göre SPPS ile sentezine uygun bağlayıcıyı/bağlayıcıları 4 seçiniz.
10.4 g–l arasından, 2'nin Şema 1'e göre SPPS ile sentezi için, Pasireotidde bulunan diğer tüm fonksiyonel grupların varlığında ortogonal olarak uzaklaştırılabilen en uygun yan zincir koruma gruplarını PG-1 ve PG-2 seçiniz. Her bir koruma grubu için yalnızca bir cevap doğrudur.
Ardından doğrusal peptit 2, aşağıdaki şemaya göre halkalı peptit 8'i oluşturmak üzere molekül içi bir kenetlenme tepkimesine girer:
Şema 3. vi) Baz
10.5 Peptit 2'nin 8'e halkalaşmasıyla ilgili doğru ifadeyi/ifadeleri seçiniz.
(a) Tepkimenin olası bir yan ürünü, \(N\)-uç fenilalanin kalıntısının tetrametilguanidillenmesi sonucunda oluşan, aşağıda gösterilen bileşik 9'dur.
(b) Tepkimenin olası bir yan ürünü, PG-1 koruma grubunun uzaklaşması ve lizin kalıntısının amino grubu üzerinden halkalaşma sonucunda oluşan, aşağıda gösterilen bileşik 10'dur.
(c) Yeterli bir tepkime hızı elde etmek için tepkime yüksek peptit derişiminde yürütülmelidir.
(d) Polikondenzasyonu önlemek için tepkime düşük peptit derişiminde yürütülmelidir.
(e) Aşağıdaki piperidin (11), tepkime için uygun bir bazdır.
Sentezin son adımları, 8'deki 4-hidroksiprolin kalıntısının OH grubunun fonksiyonelleştirilmesini ve ardından Pasireotid (1) elde etmek üzere tüm koruma gruplarının (PG) uzaklaştırılmasını içerir.
Şema 4. vii) 8'in basitleştirilmiş gösterimi olarak kullanılabilir; viii) Koruma gruplarının uzaklaştırılması
10.6 Ara ürün E'nin (stereokimya dâhil) ve reaktif F'nin yapılarını çiziniz. Şema 5'te gösterildiği gibi, E ve F yapılarında ara ürün 8'i (vii), koruma grubunu ise PG-1 olarak kısaltınız.
10.7 8'in 13'e tamamen dönüşmesini sağlamak için gereken bileşik 12'nin mümkün olan en düşük molar eşdeğer miktarını belirleyiniz.
Soru metni resmi İngilizce metinden çevrilmiştir.
Olimpiada Internacional de Química
IChO 2023
Zúrich, Suiza · 10 problemas teóricos con soluciones completas
Problema 1: Imagen molecular
La imagen molecular es una herramienta potente para el diagnóstico médico. El isómero nuclear \(\ce{^{99m}Tc}\) (m = metaestable) del isótopo \(\ce{^{99g}Tc}\) (g = estado fundamental) tiene excelentes propiedades radiativas (emisor \(\gamma\), \(t_{1/2}=6.015\ \mathrm{h}\)) para la obtención de imágenes mediante radiación. El \(\ce{^{99m}Tc}\) se obtiene por desintegración \(\beta^-\) de un nucleido progenitor en un dispositivo denominado generador de tecnecio, en forma de pertecnetato de \(\ce{^{99m}Tc}\), \(\ce{[^{99m}TcO4]^-}\).
1.1 Identifique el nucleido progenitor (A) del \(\ce{^{99m}Tc}\) y la partícula emitida (B).
1.2 Indique los estados de oxidación del radiometal en las siguientes sondas de \(\ce{^{99m}Tc}\).
Los potenciales redox de los elementos del grupo siete, manganeso (\(\ce{Mn}\)), tecnecio (\(\ce{Tc}\)) y renio (\(\ce{Re}\)), siguen la tendencia general de las tablas periódicas (véase la Figura 2 a continuación).
Figura 2
1.3 Calcule los dos potenciales redox que faltan, i y ii.
1.4 Compare \(\ce{[MnO4]^-}\), \(\ce{[TcO4]^-}\) y \(\ce{[ReO4]^-}\). Elija el agente oxidante más fuerte.
1.5 Basándose en los valores indicados en la Figura 2 de la hoja de preguntas, indique si el \(\ce{TcO2}\) se desproporcionaría en \(\ce{Tc}\) y \(\ce{TcO4^2-}\) en medio ácido.
Los complejos de \(\ce{Tc}\) y \(\ce{Re}\) en el estado de oxidación +V (sistemas \(d^2\)) que contienen un ligando terminal oxo (\(\ce{O=}\)) o nitrido (\(\ce{N#}\)) son diamagnéticos. El esquema siguiente muestra tres posibles diagramas de energía de orbitales moleculares.
1.6 Elija el diagrama de energía de orbitales que explica el diamagnetismo observado. Dibuje la configuración electrónica correspondiente en el diagrama correcto.
El \(\ce{((C4H9)4N)[^{99g}TcO4]}\) es un polvo incoloro. Al añadir \(\ce{HCl}\) concentrado, este compuesto de partida habitual en la química del \(\ce{^{99g}Tc}\) se convierte en el complejo verde \(\ce{((C4H9)4N)[^{99g}TcOCl4]}\).
1.7 Escriba las semirreacciones de oxidación y de reducción utilizando las fórmulas de los iones o de las moléculas neutras, así como la reacción redox completa.
Todos los radiotrazadores de \(\ce{^{99m}Tc}\) de uso clínico se preparan mediante reacciones «en un solo recipiente», utilizando kits comerciales. Habitualmente (\(\ce{^{99m}Tc}\) \(t_{1/2}=6.015\ \mathrm{h}\)), un eluato de un generador de \(\ce{^{99m}Tc}\) tiene una actividad de 12.5 GBq (GBq = gigabecquerel = \(10^9\) desintegraciones por segundo).
1.8 Calcule cuántos moles de \(\ce{^{99m}Tc}\) hay en estas muestras.
Para la obtención habitual de imágenes, se administran al paciente alrededor de 200 MBq de \(\ce{^{99m}Tc}\).
1.9 Suponga que no se pierde actividad por excreción. Calcule cuántas horas debe esperar el paciente hasta que la actividad inyectada disminuya por debajo del 1 % de la actividad inicial.
La bioconjugación de radiometales constituye un reto químico. Un ejemplo reciente es la cicloadición (3 + 2) de \(\ce{[^{99m}TcO3(tacn)]+}\) (A) (tacn = 1,4,7-triazaciclononano) con alquenos. En este contexto, (3 + 2) se refiere al número de átomos implicados y no al número de electrones. El siguiente esquema muestra un ejemplo de esta reacción mediante el marcaje de un carbohidrato protegido.
1.10 Dibuje las estructuras de los compuestos A y B. Indique, además, el estado de oxidación del tecnecio en estos compuestos.
Enunciado traducido del texto oficial en inglés.
Problema 2: Reducción electroquímica de CO2
Reducción electroquímica de \(\ce{CO2}\)
En los últimos años, la conversión electroquímica de \(\ce{CO2}\) en productos de mayor valor se ha considerado una estrategia prometedora y tecnológicamente viable para mitigar los efectos climáticos negativos causados por el aumento de su concentración en la atmósfera. Se han desarrollado varias tecnologías para alcanzar este objetivo. Entre ellas, la reducción de \(\ce{CO2}\) por medios electroquímicos (\(\ce{CO2}\)RR) merece especial atención por su capacidad de utilizar energía renovable para transformar el \(\ce{CO2}\), perjudicial para el medio ambiente, en productos químicos de base. Los electrocatalizadores son esenciales no solo para acelerar la \(\ce{CO2}\)RR, intrínsecamente lenta, sino también para dirigir la reacción de electrólisis hacia los productos de reacción deseados. En este contexto, la distribución de productos resultante de la \(\ce{CO2}\)RR está determinada no solo por la naturaleza química del propio catalizador, sino también por sus características morfológicas a distintas escalas de longitud. Un nuevo concepto de diseño de catalizadores para la \(\ce{CO2}\)RR se basa en la electrodeposición de materiales de tipo espuma, que ofrecen una gran superficie accesible a los reactivos (p. ej., \(\ce{H2O}\), \(\ce{H2}\) y \(\ce{CO2}\)). Los materiales basados en cobre son los únicos catalizadores metálicos conocidos para la \(\ce{CO2}\)RR capaces de producir hidrocarburos y alcoholes en cantidades significativas mediante la electrólisis de \(\ce{CO2}\).
A continuación se presentan datos termodinámicos de algunas sustancias:
\(\Delta_\mathrm{f}H^\ominus\) (\(\mathrm{kJ\,mol^{-1}}\)) \(S^\ominus\) (\(\mathrm{J\,K^{-1}\,mol^{-1}}\)) \(\ce{H2O(l)}\) −285.83 69.95 \(\ce{O2(g)}\) 0 205.15 \(\ce{H2(g)}\) 0 130.68 \(\ce{CO2(g)}\) −393.52 213.79 etanol(l) −276.00 159.86 n-propanol(l) −302.54 192.80 Tabla 1. Entalpía estándar de formación \(\Delta_\mathrm{f}H^\ominus\) y entropía estándar \(S^\ominus\) de algunas sustancias en condiciones estándar (\(T=298.15\ \mathrm{K}\), \(p^\ominus=1\ \mathrm{bar}\))
Reacción de celda \(E^\ominus\) frente al electrodo estándar de hidrógeno (SHE) (V) \(\ce{Cu^2+ + 2e- = Cu}\) +0.34 \(\ce{2H+ + 2e- = H2}\) 0.00 Tabla 2. Algunas reacciones de semicelda y sus potenciales estándar en condiciones estándar
2.1 Escriba y ajuste la ecuación química de las reacciones de semicelda correspondientes a los siguientes procesos de reducción electroquímica en medio ácido: (i) de \(\ce{CO2}\) a etanol; (ii) de \(\ce{CO2}\) a n-propanol.
2.2 Combine la semicelda del proceso de reducción con una semicelda de \(\ce{H2}/\ce{2H+}\) que actúe como ánodo. Calcule el valor del potencial estándar de celda para la reducción de \(\ce{CO2}\) a etanol.
2.3 Escriba todas las reacciones de semicelda de reducción y oxidación que tienen lugar en el cátodo y en el ánodo, respectivamente.
La Figura 1 muestra el principio de la deposición de metales mediante una plantilla dinámica de burbujas de hidrógeno.
La Figura 2 presenta imágenes de microscopía electrónica de barrido, tomadas desde arriba, de cinco espumas de \(\ce{Cu}\) diferentes obtenidas al interrumpir la deposición del metal en distintos instantes: 5 s, 20 s, 80 s.
Los procesos de electrodeposición de espumas de \(\ce{Cu}\) (véase la Figura 1) se llevaron a cabo en una disolución acuosa de ácido sulfúrico 1.5 M que contenía sulfato de cobre (\(\ce{CuSO4 * 5H2O}\)) 0.2 M como fuente de cobre. Un disco de \(\ce{Cu}\) (\(1\ \mathrm{cm^2}\)) y una lámina de \(\ce{Pt}\) sirvieron de cátodo y ánodo, respectivamente.
Figura 1. Representación de la electrodeposición de materiales de tipo espuma. Durante la deposición electroquímica del metal (flechas negras) a densidades de corriente elevadas en medios acuosos, tiene lugar la reacción de desprendimiento de hidrógeno (HER) sobre el soporte metálico (\(\ce{Cu}\)) (1). La superficie queda así parcialmente cubierta por burbujas de \(\ce{H2}\) (2). Las burbujas de \(\ce{H2}\) actúan como plantilla para la deposición del metal (3). Como resultado, se forma una espuma metálica muy porosa (4)
Figura 2. Espumas de \(\ce{Cu}\) obtenidas mediante electrodeposición galvanostática de \(\ce{Cu}\) a una densidad de corriente de \(j=-3\ \mathrm{A\,cm^{-2}}\). En cada caso, la deposición se interrumpió tras un tiempo distinto: 5 s, 20 s y 80 s. La barra de escala es la misma en todos los paneles
2.4 Teniendo en cuenta este mecanismo, asigne el tiempo de deposición correcto a las espumas de \(\ce{Cu}\) que se muestran en la Figura 2 de la hoja de respuestas (recuadros blancos en la esquina superior izquierda).
Los sistemas bimetálicos de \(\ce{CuAg}\) son excelentes catalizadores para la electrosíntesis de alcoholes a partir de \(\ce{CO2}\). Se depositaron galvanostáticamente 5.4 mg de un catalizador de espuma bimetálica de \(\ce{Cu}\)-\(\ce{Ag}\) (90 % en masa de \(\ce{Cu}\), \(M_{\ce{Cu}}=63.546\ \mathrm{g\,mol^{-1}}\); 10 % en masa de \(\ce{Ag}\), \(M_{\ce{Ag}}=107.868\ \mathrm{g\,mol^{-1}}\)) sobre una lámina de \(\ce{Cu}\) (\(1\ \mathrm{cm^2}\)) a una densidad de corriente de \(j=-3\ \mathrm{A\,cm^{-2}}\) aplicada durante 20 s (el signo negativo indica un proceso de reducción/catódico).
2.5 Calcule la eficiencia farádica (FE en %) de este proceso de deposición de metales. La FE se define como \((Q_\mathrm{product}/Q_\mathrm{total})\times100\%\), donde \(Q\) representa la carga.
Consideramos un experimento de electrólisis de \(\ce{CO2}\) llevado a cabo en 35 mL de una disolución electrolítica de \(\ce{KHCO3}\) 0.5 M saturada de \(\ce{CO2}\), sobre el catalizador de espuma bimetálica de \(\ce{Cu}\)-\(\ce{Ag}\) (90 % en masa de \(\ce{Cu}\); 10 % en masa de \(\ce{Ag}\)). La electrólisis de \(\ce{CO2}\) se llevó a cabo a una densidad de corriente (total) constante de \(j(\mathrm{tot})=-30\ \mathrm{mA\,cm^{-2}}\) durante 3600 s (obsérvese que la densidad de corriente está normalizada respecto al área superficial geométrica de \(1\ \mathrm{cm^2}\); el signo negativo indica un proceso de reducción/catódico). Un análisis de los productos, realizado después de la electrólisis, reveló concentraciones másicas de \(41.3\ \mathrm{mg\,L^{-1}}\) y \(7.4\ \mathrm{mg\,L^{-1}}\) para el etanol y el n-propanol, respectivamente. Ambos alcoholes son productos de reacción líquidos y se acumulan en el electrolito durante la reacción de electrólisis. Suponemos que se forma hidrógeno gaseoso (\(\ce{H2}\)) como único subproducto del proceso.
2.6 Calcule las densidades de corriente necesarias para la formación de (a) etanol (\(M_\mathrm{EtOH}=46.08\ \mathrm{g\,mol^{-1}}\)) y (b) n-propanol (\(M_\mathrm{PrOH}=60.10\ \mathrm{g\,mol^{-1}}\)), suponiendo que las densidades de corriente no varían con el tiempo de electrólisis.
2.7 Calcule el volumen del hidrógeno formado sobre el área de catalizador de \(1\ \mathrm{cm^2}\) a 298.15 K y 1 bar, suponiendo un comportamiento ideal del hidrógeno formado y su liberación completa a la fase gaseosa. Si no obtuvo un resultado en el apartado 2.6, continúe con FE(EtOH) = 45,1 % y FE(PrOH) = 4.8 %.
Enunciado traducido del texto oficial en inglés.
Problema 3: Fotosíntesis artificial
El campo de investigación de la fotosíntesis artificial tiene como objetivo almacenar energía solar en enlaces químicos. Los fotones se absorben al excitar sensibilizadores, lo que produce un estado con separación de cargas. El electrón excitado se transfiere a un catalizador (catalizador de producción de hidrógeno, HEC), que se reduce dos veces y después produce \(\ce{H2}\). El fotosensibilizador o absorbente de luz suele ser \(\ce{[Ru(bpy)3]^2+}\) (bpy = 2,2'-bipiridina), y los HEC suelen ser complejos de cobalto.
Energética de la descomposición del agua
3.1 Calcule la entalpía de la reacción \(\ce{H2 -> 2H+(aq) + 2e-}\).
Entalpía de solvatación del protón: \(\Delta_{\mathrm{aq}}H(\ce{H+})=-1190\ \mathrm{kJ\,mol^{-1}}\)
Energía de ionización del hidrógeno: \(IE_1=13.6\ \mathrm{eV}\)
Entalpía de disociación de \(\ce{H2}\): \(\Delta_{\mathrm{diss}}H(\ce{H2})=432\ \mathrm{kJ\,mol^{-1}}\)
En condiciones ideales, la descomposición electroquímica del agua en \(\ce{O2}\) y \(\ce{H2}\) se lleva a cabo a 1.23 V. Dado que \(T\Delta S\) es positivo para este proceso, se necesita calor del entorno. Si un voltaje adicional produce el calor necesario para compensar la disminución de temperatura, el proceso se denomina termoneutro. La entalpía de formación de \(\ce{H2O}\), \(\Delta_{\mathrm f}H^\circ(\ce{H2O})\), es \(-285\ \mathrm{kJ\,mol^{-1}}\).
3.2 Calcule (a) la entropía de la reacción de descomposición del agua \(\Delta_{\mathrm r}S^\circ\) a 25 °C para 1 mol de \(\ce{H2O}\) y (b) el voltaje al que la descomposición del agua es termoneutra.
Catalizadores
Los complejos de tipo cobalto–salen (salcomina) son posibles catalizadores para la formación de \(\ce{H2}\) a partir de protones y electrones. La estructura de la salcomina se muestra a continuación:
Figura 1. La estructura de la salcomina
3.3 Determine el estado de oxidación del átomo de cobalto en la salcomina. Determine la estructura geométrica alrededor del centro de cobalto de la salcomina, eligiendo entre estas tres posibilidades: tetraédrica, plana cuadrada u octaédrica.
En disolución, la salcomina puede unirse a \(\ce{O2}\); este enlaza dos unidades de salcomina al coordinarse con los dos centros de Co. El estado de oxidación de ambos centros de Co es entonces +III.
3.4 Dibuje la estructura resultante.
La formación de \(\ce{H2}\) tiene lugar exclusivamente en el centro de cobalto. La reacción se describe mediante un ciclo catalítico de 4 etapas que comienza con \(\ce{Co^2+}\) y utiliza 2 \(\ce{H+}\) y 2 electrones. Durante una de las etapas se forma un hidruro mediante una transferencia electrónica intramolecular.
3.5 Escriba dos posibles variantes del ciclo catalítico indicando las cargas del complejo y los estados de oxidación del centro de Co. El estado de oxidación del centro de Co no debe ser superior a +III. Marque la etapa de formación del hidruro con un asterisco e identifique la captación de \(\ce{H+}\) con C (reacción química), y la captación de electrones con E (reacción electroquímica); véase el ciclo de ejemplo de la Figura 2 a continuación. \(\ce{[Co^{II}]}\) representa el complejo cobalto–salen.
Figura 2. Un ciclo de ejemplo para el apartado 3.5
3.6 Utilizando los valores de potencial redox de distintos complejos de cobalto que se dan en la Tabla 1, indique qué complejo es adecuado para a) la oxidación del agua a pH neutro b) la reducción del agua a pH neutro. Escriba la reacción global correspondiente a ambos procesos (solo para los complejos capaces de llevarlos a cabo) y calcule el potencial de celda a pH neutro. El potencial de semicelda para la reducción de protones a pH = 7 y \(T=298\ \mathrm K\) es \(-0.41\ \mathrm V\).
Par redox Co(III/II) \(E^\circ\) frente al electrodo normal de hidrógeno \(\ce{[Co(H2O)6]}^{3+/2+}\) \(+1.92\ \mathrm V\) \(\ce{[Co(C2O4)3]}^{3-/4-}\) \(+0.55\ \mathrm V\) \(\ce{[Co(EDTA)]}^{1-/2-}\) \(+0.38\ \mathrm V\) \(\ce{[Co(NH3)6]}^{3+/2+}\) \(+0.06\ \mathrm V\) \(\ce{[Co(en)3]}^{3+/2+}\) \(-0.18\ \mathrm V\) \(\ce{[Co(CN)5]}^{2-/3-}\) \(-0.60\ \mathrm V\) Tabla 1. Posibles pares redox para el apartado 3.6; \(\ce{[C2O4]^2-}\) = oxalato, en = 1,2-etilendiamina.
Una mirada al proceso natural
La forma natural de almacenamiento de equivalentes biológicos de \(\ce{H2}\) es el NADPH, que se produce a partir de \(\ce{NADP+}\) mediante la adición de un ion hidruro. La estructura del NADPH se muestra en la Figura 3.
Figura 3. La estructura del NADPH
3.7 Dibuje la estructura de \(\ce{NADP+}\).
La clorofila tiene un coeficiente de extinción de aproximadamente \(\varepsilon=8\times10^4\ \mathrm{M^{-1}\,cm^{-1}}\) a 680 nm.
3.8 Suponiendo una eficiencia (de fotón a átomo de hidrógeno) de \(\phi=20\ \%\) con un flujo de fotones de 680 nm de \(100\ \mathrm{nE\,s^{-1}\,cm^{-2}}\) (1 E = 1 mol de fotones), calcule a) el número de fotones por segundo y b) la concentración de clorofila en una cubeta de \(1\times1\times1\ \mathrm{cm^3}\) necesaria para obtener una frecuencia de recambio de \(1\ \mathrm{nmol}\ (\ce{H2})\ \mathrm{s^{-1}}\).
Enunciado traducido del texto oficial en inglés.
Problema 4: Compuestos fluorados e hipervalentes
El flúor forma compuestos estables y aislables con prácticamente todos los elementos, incluidos los gases nobles \(\ce{Kr}\) y \(\ce{Xe}\). Las moléculas que contienen flúor suelen presentar estructuras poco comunes. Así, el flúor interviene con frecuencia en la formación de compuestos con elementos de los grupos 14–18 que se definen como hipervalentes. En la actualidad, la síntesis de compuestos orgánicos fluorados se basa en gran medida en la disponibilidad de reactivos diseñados específicamente; el compuesto 4 que aparece a continuación es un ejemplo.
Pista: Cualquier elemento \(E\) de la serie \(\mathbf{E^1}\)–\(\mathbf{E^8}\) puede aparecer más de una vez.
Parte I. Geometría molecular
4.1 Identifique los elementos \(\mathbf{E^1}\), \(\mathbf{E^2}\), \(\mathbf{E^3}\) y \(\mathbf{E^4}\) de las tres especies 1, \(\mathbf{[2]^-}\) y \(\mathbf{[3]^-}\).
1: molécula neutra, no zwitteriónica, \(\mathbf{E^1}\) piramidal cuadrada, \(\mathbf{E^2}\) octaédrica, valor medio de \(d(E^1\!-\!\ce{F})=1.91\ \text{Å}\); valor medio de \(d(E^2\!-\!\ce{F})=1.58\ \text{Å}\)
\(\mathbf{[2]^-}\): anión, piramidal cuadrada, valor medio de \(d(E^3\!-\!\ce{F})=1.96\ \text{Å}\)
\(\mathbf{[3]^-}\): anión, pentagonal plana, \(d(E^4\!-\!\ce{F})=1.98\ \text{Å}\)
Pistas:
- Las geometrías moleculares se refieren a la disposición de los átomos enlazados a \(E^1\)–\(E^4\)
- El análisis elemental de 1 da un contenido de carbono del 17.75 % en masa.
Grupo 15 Grupo 16 Grupo 17 Grupo 18 \(d(\ce{P-F})=1.50\text{–}1.68\ \text{Å}\) \(d(\ce{S-F})=1.52\text{–}1.60\ \text{Å}\) \(d(\ce{Cl-F})=1.63\text{–}1.85\ \text{Å}\) \(d(\ce{As-F})=1.68\text{–}1.72\ \text{Å}\) \(d(\ce{Se-F})=1.75\text{–}1.80\ \text{Å}\) \(d(\ce{Br-F})=1.77\text{–}1.97\ \text{Å}\) \(d(\ce{Kr-F})=1.77\text{–}1.89\ \text{Å}\) \(d(\ce{Sb-F})=1.85\text{–}2.05\ \text{Å}\) \(d(\ce{Te-F})=1.80\text{–}2.00\ \text{Å}\) \(d(\ce{I-F})=1.90\text{–}2.00\ \text{Å}\) \(d(\ce{Xe-F})=1.77\text{–}2.00\ \text{Å}\) Tabla 1. Intervalos típicos de distancias de enlace \(\ce{E-F}\) para una selección de elementos de los grupos 15–18
4.2 Elija qué elementos \(\mathbf{E^5}/\mathbf{E^6}\) y \(\mathbf{E^7}/\mathbf{E^8}\), respectivamente, presentarían la geometría indicada, con distancias de enlace \(\ce{E-F}\) próximas a las de 1 (véase la Tabla 1).
Parte II. Reactividad y estructura
Considere la reacción que se muestra a continuación:
4.3 Elija la geometría ideal del compuesto 6 en términos de la disposición de los dominios de pares de electrones de la capa de valencia alrededor del átomo de \(\ce{Te}\):
- cuadrada plana
- piramidal cuadrada
- bipiramidal trigonal
- tetraédrica
- octaédrica
Indique los ángulos de enlace ideales esperados \(C^1\!-\!\ce{Te}\!-\!\ce{I}\), \(C^2\!-\!\ce{Te}\!-\!\ce{I}\), \(\ce{I-Te-O}\) y \(C^1\!-\!\ce{Te}\!-\!C^2\).
4.4 Escriba el número de señales de RMN de \({}^{1}\mathrm{H}\) que espera para los dos grupos metilo en los compuestos 4 y 6, respectivamente.
4.5 El compuesto 6 reacciona consecutivamente con \(\ce{AgF}\) y \(\ce{(H3C)3SiCF3}\) (\(\ce{TMSCF3}\)). Formule el intermedio A y el producto final B que contienen \(\ce{Te}\), incluida su geometría correcta, así como los subproductos C y D. Dibuje A y B y escriba los subproductos C y D. Pista: La masa molar de D es \(92.08\ \mathrm{g\,mol^{-1}}\).
Suponga que el compuesto 6 reacciona con un ácido de Lewis estéricamente voluminoso, quiral y enantioméricamente puro, como el derivado de boro conocido 8, tal como se muestra a continuación. Esta reacción debería dar lugar a la formación de un nuevo producto 9, cuya composición corresponde a la suma de 6 y 8. Suponga además que 9 es una sal en la que el catión deriva de 6 y el anión de 8.
4.6 Dibuje la estructura tanto del catión que contiene \(\ce{Te}\) como del anión que contiene boro y elija la geometría ideal del catión en términos de la disposición de los dominios de pares de electrones de la capa de valencia alrededor del átomo de \(\ce{Te}\).
Pista: Para 8 (quiral, enantioméricamente puro), utilice la siguiente representación esquemática:
Elija la geometría molecular ideal del catión:
- cuadrada plana
- trigonal plana
- piramidal trigonal
- bipiramidal trigonal
- tetraédrica
4.7 Indique el número de sales 9 estereoquímicamente diferentes posibles.
Parte III. Síntesis de un \(\lambda^3\)-difluoroyodano y rotación alrededor de un enlace sencillo
El compuesto 10 se prepara a partir del material de partida 8 mediante oxidación con ácido tricloroisocianúrico (TCICA, 9) en presencia de un exceso de \(\ce{KF}\) en acetonitrilo anhidro, tal como se muestra a continuación.
4.8 Escriba las semirreacciones ajustadas y una reacción global ajustada para este proceso.
Pista: Abrevie 10 como \(\ce{R-I}\), 11 como \(\ce{R-IF2}\) y TCICA como \(\ce{C3Cl3N3O3}\). El anillo de seis miembros del TCICA permanece intacto tras la reducción.
El grupo \(\ce{IF2}\) de 12 puede rotar alrededor del enlace \(\ce{I-C}\) (imagine una hélice molecular). La barrera de rotación correspondiente se ha medido experimentalmente, \(E_\mathrm{a}=30\ \mathrm{kJ\,mol^{-1}}\). Además, la constante de velocidad de la rotación es \(k=2500\ \mathrm{s^{-1}}\) a \(228\ \mathrm{K}\).
4.9 Determine a qué velocidad puede rotar, en principio, el grupo \(\ce{IF2}\) a temperatura ambiente (\(298\ \mathrm{K}\)). Considere este proceso como si fuera una reacción química cuya constante de velocidad está determinando. Escriba su respuesta en la hoja de respuestas. La unidad de la constante debe expresarse en \(\mathrm{s^{-1}}\).
Enunciado traducido del texto oficial en inglés.
Problema 5: Hidrodesulfuración
La producción de combustibles libres de azufre es la tendencia general para reducir las emisiones de compuestos que contienen azufre y son tóxicos para el medio ambiente. Para eliminar el azufre, en las refinerías se utiliza el proceso de hidrodesulfuración con hidrógeno.
5.1 Dibuje la estructura de los productos A a E de la hidrodesulfuración del tiofeno, sabiendo que A y B son regioisómeros cíclicos y que C es cíclico.
Figura 1. Proceso de hidrodesulfuración del tiofeno
Los dos isótopos estables naturales más comunes del azufre son \(\ce{^{32}S}\) y \(\ce{^{34}S}\), con abundancias molares relativas de \(x(\ce{^{32}S})=94.8\,\%\) y \(x(\ce{^{34}S})=4.37\,\%\), respectivamente. En el caso del hidrógeno, los isótopos estables naturales son \(\ce{^{1}H}\) y \(\ce{^{2}H}\) (\(\ce{D}\)), con abundancias molares relativas de \(x(\ce{^{1}H})=99.986\,\%\) y \(x(\ce{^{2}H})=0.014\,\%\), respectivamente.
5.2 Considerando únicamente los isótopos indicados anteriormente, enumere todos los isotopólogos del \(\ce{H2S}\).
5.3 Considerando únicamente los isótopos indicados anteriormente, enumere todos los isotopólogos del \(\ce{H2S}\) que contengan simultáneamente núcleos de \(\ce{D}\) y \(\ce{^{34}S}\) y calcule para cada uno su abundancia molar relativa en %.
La desulfuración es un proceso catalítico que normalmente se lleva a cabo sobre un catalizador de \(\ce{MoS2}\) soportado sobre \(\ce{SiO2}\) (\(\ce{MoS2}/\ce{SiO2}\)). Para estudiar la superficie del catalizador pueden emplearse métodos de intercambio isotópico. La reacción de intercambio isotópico tiene lugar en la interfase gas-sólido, y da lugar al intercambio exclusivo de los átomos de la superficie. En una primera aproximación, los átomos del interior no participan en el intercambio (Figura 2).
En el experimento se estudió el intercambio isotópico entre el catalizador de \(\ce{MoS2}/\ce{SiO2}\) (fracción másica de Mo \(w_{\mathrm{Mo}}=4.280\,\%\), que inicialmente contenía únicamente \(\ce{^{32}S}\)) y \(\ce{H2^{34}S}\) gaseoso marcado isotópicamente, en un reactor de flujo (Figura 2). El catalizador de \(\ce{MoS2}/\ce{SiO2}\) (\(m_{\mathrm{cat}}=1.2350\,\mathrm{g}\)) se mantuvo en una corriente (\(p=1.00\,\mathrm{bar}\), \(v=20.0\,\mathrm{mL\,min^{-1}}\), \(T=23.0\,^\circ\mathrm{C}\)) de una mezcla gaseosa que contenía \(\ce{H2^{34}S}\), con \(\ce{Ar}\) como gas de balance (fracción volumétrica \(\varphi(\ce{H2^{34}S})=1.00\,\%\), pureza isotópica del \(\ce{^{34}S}\) \(\alpha=99.95\ \text{mol.}\,\%\)). La duración del experimento fue de \(t=10.0\,\mathrm{min}\) y se recogió el gas de salida durante todo el experimento. La fracción medida del isótopo \(\ce{^{34}S}\) entre los átomos de azufre (\(\gamma\)) en la fase gaseosa recogida fue \(\gamma=87.3\ \text{mol.}\,\%\). Suponga un comportamiento de gas ideal, que la composición elemental (¡no isotópica!) del \(\ce{MoS2}\) en la superficie y en el interior es idéntica, y que al final del experimento todos los átomos de azufre de la superficie se han intercambiado con la fase gaseosa.
Figura 2. Representación esquemática del experimento durante su transcurso (A) y en la etapa final (B). Los átomos de azufre de la superficie se muestran en rojo y los átomos de azufre del interior, en azul. No se muestran los átomos de molibdeno.
5.4 Calcule la cantidad de átomos de azufre intercambiados \(n(\ce{S})_{\mathrm{surface}}\) en mol.
Si no ha podido calcular la cantidad de átomos de azufre intercambiados, utilice el valor \(1.53\times10^{-5}\,\mathrm{mol}\) en todos los cálculos siguientes.
Suponga que la fase de \(\ce{MoS2}\) está formada por partículas esféricas uniformes, y que al final del experimento todos los átomos de azufre situados en la superficie se han intercambiado, mientras que los átomos del interior no han participado en la reacción de intercambio. La densidad del \(\ce{MoS2}\) es \(\rho=5.06\,\mathrm{g\,cm^{-3}}\), y el área media ocupada por los átomos de \(\ce{S}\) y \(\ce{Mo}\) en la superficie es igual a \(A_{\mathrm{S}}=3.00\times10^{-19}\,\mathrm{m^2}\) y \(A_{\mathrm{Mo}}=5.00\times10^{-19}\,\mathrm{m^2}\), respectivamente. El área de una esfera de radio \(R\) puede calcularse como \(S=4\pi R^2\), y su volumen como \(V=(4/3)\pi R^3\). Suponga que la composición isotópica no afecta a la densidad del \(\ce{MoS2}\).
5.5 Calcule el radio \(R\) de las partículas de \(\ce{MoS2}\). Exprese su respuesta en nm.
En realidad, los átomos marcados isotópicamente de la superficie se difunden hacia el interior y los átomos no marcados del interior se desplazan hacia la superficie, de modo que experimentan un intercambio gradual (Figura 3A). Por tanto, en un instante dado, la fracción de átomos marcados dentro de la partícula disminuye desde la superficie de la partícula hasta su centro. Simultáneamente, a medida que aumenta el tiempo de intercambio, aumenta la participación de los átomos del interior en la reacción de intercambio, como se ilustra en la Figura 3B.
Figura 3. A) Representación esquemática de la difusión de los isótopos del azufre desde la superficie hacia el interior de una partícula de \(\ce{MoS2}\). Los átomos de azufre de la superficie se muestran en rojo y los átomos de azufre del interior, en azul. No se muestran los átomos de molibdeno. B) Fracción de átomos de \(\ce{^{34}S}\) en el interior en función del tiempo y de la distancia al centro de la partícula; \(r_{\mathrm{edge}}\) corresponde al radio de la partícula de \(\ce{MoS2}\).
Al final del experimento, los átomos de la superficie se han intercambiado por completo y, además, una fracción de los átomos del interior se ha intercambiado por difusión. La fracción de átomos del interior intercambiados, \(n(\ce{S})_{\mathrm{bulk}}^{\mathrm{ex}}\), respecto al total de átomos de azufre del interior, \(n(\ce{S})_{\mathrm{bulk}}^{\mathrm{total}}\), puede calcularse como:
\[ F=n(\ce{S})_{\mathrm{bulk}}^{\mathrm{ex}}/ n(\ce{S})_{\mathrm{bulk}}^{\mathrm{total}} =1-\exp(-Dt/R^2) \]
Donde \(t\) es el tiempo del experimento de intercambio (descrito anteriormente), \(R\) es el radio de la partícula y \(D\) es el coeficiente de difusión. El catalizador descrito anteriormente se estudió de forma independiente mediante microscopía electrónica, que mostró que las partículas de \(\ce{MoS2}\) son esferas distribuidas uniformemente con un radio de \(35.0\,\mathrm{nm}\).
5.6 Utilizando \(R=35.0\,\mathrm{nm}\) y los datos del experimento de intercambio descrito anteriormente, calcule el coeficiente de difusión \(D\) (en \(\mathrm{m^2\,s^{-1}}\)) para la difusión de átomos de azufre en \(\ce{MoS2}\). En sus cálculos, utilice la aproximación \(e^x\approx1+x\) para \(x\ll1\).
Enunciado traducido del texto oficial en inglés.
Problema 6: Conversión directa de metano en metanol
El metano está ampliamente disponible en forma de gas natural, lo que lo convierte en una materia prima atractiva para la industria química, por ejemplo, para la producción de metanol. Sin embargo, controlar este proceso es difícil, ya que el metanol se oxida con mayor facilidad que el metano. La oxidación excesiva se evita mediante un proceso de ciclo químico, en el que los centros activos de los catalizadores de zeolita intercambiada con cobre proporcionan únicamente el átomo de oxígeno necesario para la oxidación a metanol y se consumen. En una segunda etapa, el catalizador se regenera con oxígeno en ausencia de metano. El esquema siguiente muestra dos posibles centros catalíticos de cobre. Durante la reacción, el Cu(II) se reduce a Cu(I).
6.1 Indique el número de centros S1 y el número de centros S2 necesarios para oxidar una molécula de metano a metanol.
En ausencia de oxígeno, el metanol formado no se desorbe de la zeolita. Si la reacción se lleva a cabo en un recipiente a volumen y temperatura constantes (un autoclave), la caída de presión se debe únicamente al consumo de metano, que puede considerarse un gas ideal. En un autoclave de 1 L que contiene 200 mg de zeolita con una carga de cobre del 4.3 % en masa, la presión inicial de metano \(p_0 = 933\ \mathrm{Pa}\) descendió a \(p_\infty = 925\ \mathrm{Pa}\) tras completarse la reacción a 528 K.
6.2 Calcule el porcentaje de cobre que reaccionó.
6.3 Los datos experimentales se representan en la Figura 1. A partir de ellos, determine el (pseudo)orden de la oxidación de \(\ce{CH4}\).
(a) La reacción es de (pseudo)orden cero.
(b) La reacción es de (pseudo)primer orden.
(c) La reacción es de (pseudo)segundo orden.
Figura 1. Gráfica semilogarítmica de la presión normalizada de metano frente al tiempo para la reacción con zeolita cargada con cobre que contiene centros S1 y S2, en un autoclave a diversas temperaturas. Los símbolos representan los puntos experimentales. Las líneas continuas son ajustes lineales en intervalos de tiempo apropiados. Las líneas de puntos sirven como guías visuales
6.4 Escriba la ley de (pseudo)velocidad para la oxidación de \(\ce{CH4}\) que sea coherente con los datos experimentales en las condiciones indicadas. Tenga en cuenta que puede depender tanto de las concentraciones de \(\ce{CH4}\) y de los centros S1 y S2 como de las constantes de velocidad.
6.5 Elija la(s) afirmación(es) correcta(s).
(a) Reaccionan al menos dos tipos de centros de cobre, cada uno con una constante de velocidad distinta.
(b) La oxidación global del metano por la zeolita es más rápida a mayor temperatura.
(c) A mayor temperatura, una fracción mayor de los centros de cobre habrá reaccionado con el metano una vez completada la reacción.
(d) Una de las reacciones se vuelve más lenta a mayor temperatura.
Los centros paramagnéticos S1 pueden observarse mediante espectroscopia de resonancia paramagnética electrónica (EPR), mientras que los centros diamagnéticos S2 no dan señal de EPR. La espectroscopia EPR mide el número de espines electrónicos. Por tanto, el número de centros S1 es proporcional a la integral doble \(I_2\) del espectro de EPR, es decir, \([\mathbf{S1}] \propto I_2\). Se midieron espectros a diferentes temperaturas \(T\) y, a cada temperatura, a diferentes tiempos, \(t\), tras iniciar la reacción.
6.6 Deduzca la ecuación, lineal en el tiempo, que relaciona \(I_2(t)\) con la constante de velocidad de la desaparición de los centros S1.
6.7 Marque las casillas de la hoja de respuestas correspondientes a cada medida que deba calibrarse con un patrón conocido de Cu(II).
(a) Número total de centros paramagnéticos de Cu(II) en la muestra.
(b) Concentración de centros paramagnéticos de Cu(II) en la muestra.
(c) Constante de velocidad.
(d) Tipos de las distintas especies paramagnéticas de Cu(II) en la muestra.
A partir de las medidas de EPR, se sabe que la constante de velocidad de la reacción con los centros S1 a 528 K es \(2.604 \times 10^{-3}\ \mathrm{s^{-1}}\).
6.8 Considerando la Figura 1 y basándose en un cálculo, determine si el metano reacciona más rápida o más lentamente con los centros S2 que con los centros S1.
(a) El metano reacciona más rápidamente con S1.
(b) Ambas velocidades de reacción son iguales.
(c) El metano reacciona más rápidamente con S2.
El metanol puede transformarse posteriormente en olefinas de valor mediante distintos catalizadores de zeolita. En este proceso se observa un producto intermedio con una masa molar de \(86.09\ \mathrm{g\,mol^{-1}}\), un análisis elemental (55.8 % en masa de \(\ce{C}\), 7.0 % en masa de \(\ce{H}\)) y un espectro de RMN de \({}^{1}\mathrm{H}\) que consta de señales a cuatro desplazamientos químicos distintos:
a: 12.2 ppm (1H, s), ancha, desaparece al añadir \(\ce{D2O}\)
b: 6.3 ppm (1H, d)
c: 5.7 ppm (1H, d)
d: 2.0 ppm (3H, s)
6.9 Dibuje la estructura del producto intermedio y asigne los protones a y d.
El Departamento de Energía de los Estados Unidos designó doce compuestos químicos que contienen únicamente \(\ce{C}\), \(\ce{H}\) y \(\ce{O}\) como compuestos químicos plataforma. Estos son los candidatos más prometedores, fáciles de preparar a partir de recursos renovables y a partir de los cuales pueden prepararse múltiples derivados de interés. Uno de ellos es el compuesto A, que puede transformarse en otros derivados o utilizarse, por ejemplo, en aplicaciones medicinales o en detergentes.
- RMN de \({}^{1}\mathrm{H}\) en DMSO: 7.81 ppm (a, s), 13.0 ppm (b, s, ancha, desaparece al añadir \(\ce{D2O}\)); ambas señales tienen la misma integral.
- RMN de \({}^{13}\mathrm{C}\): 165.1 ppm (1), 150.6 ppm (2) y 120.6 ppm (3).
- \(M = 156.03\ \mathrm{g\,mol^{-1}}\). Análisis elemental: 46.15 % en masa de \(\ce{C}\), 2.56 % en masa de \(\ce{H}\).
6.10 Proponga una posible estructura de A y asigne todos los protones y el carbono 1.
Enunciado traducido del texto oficial en inglés.
Problema 7: Cinética enzimática
El mecanismo de Michaelis–Menten (MM), introducido en 1913, describe la cinética de la catálisis enzimática. En este mecanismo, la enzima \(\ce{E}\) cataliza la conversión del sustrato \(\ce{S}\) en el producto \(\ce{P}\):
La velocidad inicial de una reacción enzimática que sigue el mecanismo MM viene dada por
\[ v_0=v_{\max}\frac{[\ce{S}]_0}{K_{\mathrm M}+[\ce{S}]_0} \tag{1} \]
cuando la concentración inicial de \(\ce{E}\) es mucho menor que la concentración inicial de \(\ce{S}\), \([\ce{E}]_0\ll[\ce{S}]_0\). La constante de Michaelis se define como \(K_{\mathrm M}=(k_2+k_3)/k_1\). La velocidad inicial también puede expresarse como el producto del flujo relativo \(j\) y \([\ce{E}]_0\):
\[ v_0=j[\ce{E}]_0 \tag{2} \]
Nota: Las preguntas 7.1 y 7.2 pueden tener una, varias o ninguna respuesta correcta.
7.1 Elija las formas alternativas correctas de las expresiones (1) y (2) de la velocidad inicial (\(v_0\)).
\([\ce{ES}]_{\max}\) es la concentración máxima del complejo \(\ce{ES}\).
- (a) \(\displaystyle v_0=\frac{k_3[\ce{E}]_0[\ce{S}]_0}{K_{\mathrm M}+[\ce{S}]_0}\)
- (b) \(\displaystyle v_0=\frac{k_3[\ce{E}]}{K_{\mathrm M}/[\ce{S}]_0+1}\)
- (c) \(\displaystyle v_0=j[\ce{ES}]_{\max}\)
- (d) \(\displaystyle v_0=\frac{k_3[\ce{E}]_0[\ce{ES}]_{\max}}{K_{\mathrm M}+[\ce{S}]_0}\)
- (e) \(\displaystyle v_0=\frac{k_3[\ce{E}]_0}{K_{\mathrm M}/[\ce{S}]_0+1}\)
- (f) \(\displaystyle v_0=\frac{j[\ce{E}]_0}{K_{\mathrm M}+[\ce{S}]_0}\)
7.2 Elija los pares de ejes (\(y\) frente a \(x\)) que se espera que den una gráfica lineal.
- (a) \(v_0\) frente a \(1/[\ce{S}]_0\)
- (b) \(v_0\) frente a \(v_0/K_{\mathrm M}\)
- (c) \(v_0\) frente a \(K_{\mathrm M}/v_0\)
- (d) \(1/v_0\) frente a \(v_0/[\ce{S}]_0\)
- (e) \(1/v_0\) frente a \(v_0/K_{\mathrm M}\)
- (f) \([\ce{S}]_0/v_0\) frente a \([\ce{S}]_0\)
Muchas enzimas catalizan transformaciones de varios sustratos en lugar de uno solo. Sin embargo, si la concentración de uno de los sustratos es mucho mayor que la del otro sustrato o se mantiene constante, la cinética MM también es válida. Aquí examinaremos dos sistemas enzimáticos independientes que siguen la cinética MM.
Sistema enzimático I
La enzima \(\ce{E}\) convierte los sustratos \(\ce{A}\) y \(\ce{B}\) en los productos \(\ce{P_A}\) y \(\ce{P_B}\). En condiciones de preequilibrio rápido entre la enzima libre y todos los complejos enzima–sustrato, se cumple la siguiente ecuación:
\[ v_0= \frac{k[\ce{E}]_0[\ce{A}]_0[\ce{B}]_0} {(K+[\ce{A}]_0)(K+[\ce{B}]_0)} \tag{3} \]
donde \(k\) es la constante de velocidad de una de las reacciones. La misma constante de equilibrio \(K\) caracteriza la disociación de cualquiera de los dos sustratos del centro activo correspondiente de \(\ce{E}\).
7.3 Demuestre que la ecuación (3) adopta la forma MM (1) si la concentración del sustrato \(\ce{B}\) se mantiene en un valor constante \(c_0\). Dé la expresión de \(v_{\max}\) en este caso.
7.4 Proponga un esquema cinético para el Sistema enzimático I compatible con la ec. (3), mostrando todos los intermedios y productos. Indique la reacción cuya constante de velocidad es \(k\).
Sistema enzimático II
La enzima \(\ce{E}\) tiene cinco centros activos, cada uno de los cuales es específico para uno de los sustratos \(\ce{S_A}\), \(\ce{S_B}\) o \(\ce{S_C}\), que se transforman selectivamente en los productos \(\ce{P_A}\), \(\ce{P_B}\) o \(\ce{P_C}\), respectivamente. Hay al menos un centro activo para cada sustrato. Cada centro activo es independiente de los demás.
Para \(\ce{E}\), se sabe que:
-
La afinidad por \(\ce{S_C}\) es mayor que por \(\ce{S_B}\).
-
La gráfica de \(v_{0i}\) frente a \(v_{0i}/[\ce{S_i}]_0\), conocida como gráfica de Eadie–Hofstee, para \(\ce{S_A}\), \(\ce{S_B}\) y \(\ce{S_C}\), con la velocidad expresada por centro activo (\(v_{0i}\)), se muestra a continuación, pero se han omitido la escala y la leyenda.
-
Cuando \(\ce{E}\) está saturada con \(\ce{S_A}\), \(\ce{S_B}\) y \(\ce{S_C}\), el número de recambio catalítico (TON) para \(\ce{S_C}\) por centro es \(10200\ \mathrm{min^{-1}}\), y se sintetizan en total 2023 moléculas de los productos \(\ce{P_A}\), \(\ce{P_B}\) y \(\ce{P_C}\) por segundo. Al mismo tiempo, se detecta la formación de no más de \(5.94\times10^6\) moléculas de \(\ce{P_A}\) y \(\ce{P_B}\) por hora.
-
A concentraciones equimolares de \(\ce{S_A}\), \(\ce{S_B}\) y \(\ce{S_C}\), que son al menos 1000 veces menores que los valores correspondientes de \(K_{\mathrm M,i}\), las concentraciones de \(\ce{P_A}\), \(\ce{P_B}\) y \(\ce{P_C}\) pasan a ser proporcionales a la eficiencia catalítica \((\varepsilon_i=k_{i3}/K_{\mathrm M,i})\), y su proporción es \(3:2:5\), respectivamente.
-
Dos complejos \(\ce{ES_i}\) tienen constantes de velocidad iguales para su disociación en \(\ce{E}\) y \(\ce{S_i}\). La barrera de activación para la reacción de \(\ce{ES_C}\) que da lugar a los compuestos iniciales es \(1266\ \mathrm{J\,mol^{-1}}\) mayor que la de la reacción que da lugar a los productos finales. Suponga que los factores preexponenciales son iguales para ambas reacciones y que \(T=25\,^\circ\mathrm C\).
-
Para la reacción \(\ce{E + S_i}\): \(k_{\mathrm{c1}}=1.57\times10^7\ \mathrm{M^{-1}\,s^{-1}}\) y \(k_{\mathrm{a1}}=k_{\mathrm{b1}}\).
7.5 Complete la tabla siguiente y presente sus cálculos. Pistas:
- Utilice la información de los puntos 1 y 2 para encontrar la relación (\(<\), \(>\), \(=\)) entre las constantes \(K_{\mathrm M,A}\), \(K_{\mathrm M,B}\) y \(K_{\mathrm M,C}\).
- La información de los puntos 3 y 5 permite completar la primera columna (número de centros activos para cada sustrato) y la última fila (todas las constantes del sustrato \(\ce{S_C}\)) de la tabla. Compruebe que la suma de centros activos sea igual a 5.
N.º de centros activos \(k_1\) \(k_2\) \(k_3\) \(K_{\mathrm M}\) \(\ce{S_A}\) \(\ce{S_B}\) \(\ce{S_C}\) \(1.57\times10^7\ \mathrm{M^{-1}\,s^{-1}}\) Enunciado traducido del texto oficial en inglés.
Problema 8: Reacción de Nazarov
La reacción de Nazarov es una reacción de las divinil cetonas utilizada frecuentemente para obtener ciclopentenonas. Transcurre por vía fotoquímica o mediante catálisis ácida y consiste en una electrociclación seguida de una transferencia de protón.
8.1 Dibuje los orbitales moleculares π para describir la reacción de Nazarov. Coloque los electrones en los niveles de energía correspondientes. Marque con una x el (i) HOMO (orbital molecular ocupado de mayor energía) y el (ii) LUMO (orbital molecular desocupado de menor energía). Para este ejercicio, puede considerar la divinil cetona como un catión pentadienilo con cinco orbitales p.
8.2 A partir de los orbitales moleculares π que ha obtenido en el apartado 8.1, prediga en qué condiciones la reacción de Nazarov de la divinil cetona transcurrirá de forma disrotatoria o conrotatoria. Marque con una x en la tabla las condiciones en las que la reacción está permitida.
Disrotatoria Conrotatoria Térmica Fotoquímica 8.3 La reacción de Nazarov se utilizó como reacción clave en una síntesis de farnesina. Para las dos condiciones indicadas a continuación, dibuje una estructura posible de cada uno de los compuestos A y B, incluida su estereoquímica. Tenga en cuenta que los productos de ambas reacciones presentan una señal a 6.70–6.73 ppm en la RMN de \(\ce{^1H}\).
La síntesis de capneleno comienza con el aldehído insaturado C que se muestra a continuación. El tratamiento con D, seguido de la reacción con \(\ce{MnO2}\) soportado sobre carbono, dio la divinil cetona E que se muestra a continuación. El tratamiento con una mezcla de \(\ce{P2O5}\) y MsOH produjo F, que se transformó mediante una secuencia de reacciones en la cetona insaturada I.
8.4 Elija de la lista el reactivo o los reactivos que serían adecuados como D.
(a) \(\ce{H2C=CHMgBr}\) (c) \(\ce{H2C=CHBr}\), \(\ce{Pd(PPh3)4}\)
(b) 1. \(\ce{NaBH4}\) 2. \(\ce{H2C=CHLi}\) (d) \(\ce{H2C=CHMgBr}\), \(\ce{CuI}\)
8.5 Indique las estructuras de los intermedios F, G y H, incluida su estereoquímica.
A continuación, la enona I se trató con \(\ce{H2C=CHMgBr}\) y \(\ce{CuI}\) en THF para dar el intermedio J, seguido de ozonólisis para obtener el intermedio K, que presenta una señal a 9.61 ppm en la RMN de \(\ce{^1H}\). El tratamiento con \(\ce{KOH}\) al 5 % en una mezcla de THF y éter produjo el intermedio L. La hidrogenación con un catalizador de Pt y bajo una atmósfera de \(\ce{H2}\) produjo M, que finalmente dio lugar al capneleno.
8.6 Indique las estructuras de J, K, L y M, incluida su estereoquímica.
Enunciado traducido del texto oficial en inglés.
Problema 9: Electrólisis en síntesis orgánica
La electrólisis de Kolbe describe la dimerización descarboxilativa de dos ácidos carboxílicos y solo tiene lugar si el ácido está desprotonado. A continuación se muestra la ecuación sin ajustar.
Durante la reacción se producen dos gases (B y C). B reacciona con \(\ce{Ca(OH)2}\), mientras que C es muy inflamable.
9.1 Indique las fórmulas estructurales de A, B y C.
9.2 La síntesis es formalmente una reacción redox, en la que el carboxilato se oxida y el disolvente se reduce. Escriba las semirreacciones de oxidación y reducción y la reacción redox global.
9.3 Indique los intermedios 1 y 2 del mecanismo de descarboxilación oxidativa y formación del producto.
La electrólisis de Kolbe suele ser eficiente únicamente para ácidos carboxílicos saturados de cadena larga, y no para determinados ácidos carboxílicos, como D. En este caso, se favorece la sobreoxidación del intermedio radicalario E a una especie con carga positiva F. El intermedio F puede reaccionar con nucleófilos para formar distintos productos secundarios; por ejemplo, reacciona con D para formar un éster G, y con \(\ce{MeOH}\) para formar H.
9.4 Indique las estructuras de D–H.
La electrólisis del ácido carboxílico I en presencia de un exceso del coácido J da lugar a dos productos principales (según el análisis por RMN de \({}^{1}\mathrm{H}\)) que no pueden separarse mediante cromatografía en gel de sílice. Sus datos espectroscópicos son casi idénticos. En la RMN de \({}^{1}\mathrm{H}\), las dos especies solo se distinguen por dos señales con pequeñas diferencias en sus desplazamientos químicos.
El espectro de RMN de \({}^{1}\mathrm{H}\) es el siguiente (mezcla 1:1 de los productos K y L):
4.18–4.08 (m, 4 H), 3.95–3.60 (m, 6 H), 3.43 (dt, 2 H, \(J=7.8,\ 2.2\ \mathrm{Hz}\)),
2.55–2.25 (m, 4 H), 2.20–1.95 (m, 2 H), 1.65–1.50 (m, 2 H)Señales específicas de K:
1.26 (t, 3 H, \(J=7.2\ \mathrm{Hz}\)), 1.20 (d, 3 H, \(J=6.6\ \mathrm{Hz}\))
Señales específicas de L:
1.24 (t, 3 H, \(J=7.2\ \mathrm{Hz}\)), 1.15 (d, 3 H, \(J=6.6\ \mathrm{Hz}\))
9.5 Indique las estructuras de los productos K y L. Indique qué relación existe entre ellos.
(a) Epímeros (b) Enantiómeros
(c) Diastereómeros (d) Isómeros constitucionales
La elección del material del electrodo puede influir en la selectividad de una reacción de electrosíntesis orgánica. La electrólisis reductora del benzaldehído (M) (16 mM en \(\ce{KOH}\) acuoso 1 M, ánodo de \(\ce{Pt}\), −1.3 V frente a \(\ce{Ag/AgCl}\)) da lugar a distintos productos dependiendo del material empleado como cátodo. Una unión fuerte a la superficie favorece las reacciones intermoleculares. La figura siguiente muestra la distribución de productos para distintos materiales de cátodo y los espectros de masas de los productos.
9.6 Indique las estructuras de N y O.
Los alquenos, como los éteres enólicos, pueden acoplarse oxidativamente. Esto suele implicar la oxidación anódica del fragmento de alqueno para generar un catión radical que puede ser capturado por un nucleófilo.
9.7 Indique las fórmulas estructurales de P, Q, R y S en el esquema siguiente. No es necesario indicar la estereoquímica. Pista: S es un producto tricíclico.
Enunciado traducido del texto oficial en inglés.
Problema 10: Suiza — El país de los productos farmacéuticos
La pasireotida (1) es un fármaco peptídico desarrollado por la empresa farmacéutica suiza Novartis para tratar la enfermedad de Cushing.
10.1 Determine el número de centros estereogénicos (\(n\)) de la pasireotida (1). Calcule el número total de todos los estereoisómeros posibles (\(t\)).
La pasireotida (1) es un péptido cíclico. Un intermedio avanzado de su síntesis (el péptido lineal 2) puede prepararse mediante síntesis de péptidos en fase sólida (SPPS) utilizando la estrategia Fmoc/tBu, como se muestra en el Esquema 1.
Esquema 1. SPPS del péptido 2. i) Enlazador; ii) Resina; iii) Carga de la resina; iv) SPPS: repetición de 1. Desprotección de Fmoc 2. Acoplamiento de aminoácidos + desprotección final de Fmoc; v) Escisión del péptido de la resina y desprotección de PG-2.
La síntesis comienza con la preparación de Fmoc-Tyr(Bn)-OH (3) a partir de Boc-Tyr-OH (7).
10.2 Dibuje los reactivos A y D y los intermedios B y C de la síntesis de Fmoc-Tyr(Bn)-OH (3) que se muestra arriba.
La SPPS del intermedio 2 comienza con la unión de Fmoc-Tyr(Bn)-OH (3) a un enlazador adecuado unido a una resina.
Esquema 2. ii) Resina; a) Enlazador de cloruro de 2-clorotritilo; b) Enlazador de seguridad (safety-catch); c) Enlazador de amida de Rink; d) Enlazador de cloruro de SASRIN; e) Enlazador de amida de Sieber; f) Enlazador de Wang
10.3 Elija el enlazador o los enlazadores 4 del Esquema 2 que sean adecuados para la SPPS del péptido 2 según el Esquema 1.
10.4 Entre g–l, elija los grupos protectores de las cadenas laterales PG-1 y PG-2 más adecuados para la SPPS de 2 según el Esquema 1, que puedan escindirse de forma ortogonal en presencia de todos los demás grupos funcionales presentes en la pasireotida. Solo hay una respuesta correcta para cada grupo protector.
A continuación, el péptido lineal 2 experimenta una reacción de acoplamiento intramolecular para formar el péptido cíclico 8 según el siguiente esquema:
Esquema 3. vi) Base
10.5 Elija la afirmación o las afirmaciones correctas sobre la ciclación del péptido 2 para dar 8.
(a) Un posible producto secundario de la reacción se forma por tetrametilguanidilación del residuo de fenilalanina del extremo \(N\)-terminal, dando lugar al compuesto 9 que se muestra a continuación.
(b) Un posible producto secundario de la reacción se forma por escisión del grupo protector PG-1 y ciclación a través del grupo amino del residuo de lisina, para dar el compuesto 10 que se muestra a continuación.
(c) La reacción debe llevarse a cabo a una concentración elevada de péptido para alcanzar una velocidad de reacción suficiente.
(d) La reacción debe llevarse a cabo a una concentración baja de péptido para evitar la policondensación.
(e) La piperidina (11), que se muestra a continuación, es una base adecuada para la reacción.
Los últimos pasos de la síntesis comprenden la funcionalización del grupo OH del residuo de 4-hidroxiprolina de 8, seguida de la escisión de todos los grupos protectores (PG) para dar pasireotida (1).
Esquema 4. vii) Puede utilizarse como representación simplificada de 8; viii) Escisión de los grupos protectores
10.6 Dibuje las estructuras del intermedio E (incluida su estereoquímica) y del reactivo F. Abrevie el intermedio 8 como (vii) y el grupo protector como PG-1 en las estructuras E y F, tal como se indica en el Esquema 5.
10.7 Determine el número mínimo de equivalentes molares del compuesto 12 necesarios para permitir la conversión completa de 8 en 13.
Enunciado traducido del texto oficial en inglés.
国际化学奥林匹克
IChO 2023
瑞士苏黎世 · 10 道理论题及完整解答
题目 1:分子成像
分子成像是医学诊断中的一种强大工具。同位素 \(\ce{^{99g}Tc}\)(g = 基态)的核同质异能素 \(\ce{^{99m}Tc}\)(m = 亚稳态)具有优异的辐射特性(\(\gamma\) 发射体,\(t_{1/2}=6.015\ \mathrm{h}\)),适用于放射性成像。\(\ce{^{99m}Tc}\) 在所谓的锝发生器中由母核素经 \(\beta^-\) 衰变产生,以 \(\ce{^{99m}Tc}\) 标记的高锝酸根 \(\ce{[^{99m}TcO4]^-}\) 的形式获得。
1.1 确定 \(\ce{^{99m}Tc}\) 的母核素(A)和发射的粒子(B)。
1.2 给出下列 \(\ce{^{99m}Tc}\) 探针中放射性金属的氧化态。
第七族元素锰(\(\ce{Mn}\))、锝(\(\ce{Tc}\))和铼(\(\ce{Re}\))的氧化还原电势遵循元素周期表中的一般变化趋势(见下方图 2)。
图 2
1.3 计算缺失的两个氧化还原电势 i 和 ii。
1.4 比较 \(\ce{[MnO4]^-}\)、\(\ce{[TcO4]^-}\) 和 \(\ce{[ReO4]^-}\)。选出最强的氧化剂。
1.5 根据试题中图 2 所示的数值,判断 \(\ce{TcO2}\) 在酸性条件下是否会歧化生成 \(\ce{Tc}\) 和 \(\ce{TcO4^2-}\)。
含有端位氧配体(\(\ce{O=}\))或端位氮配体(\(\ce{N#}\))的 +V 氧化态 \(\ce{Tc}\) 和 \(\ce{Re}\) 配合物(\(d^2\) 体系)具有抗磁性。下图给出了三种可能的分子轨道能级图。
1.6 选择能够解释所观察到的抗磁性的轨道能级图。在正确的图中画出相应的电子排布。
\(\ce{((C4H9)4N)[^{99g}TcO4]}\) 是一种无色粉末。加入浓 \(\ce{HCl}\) 后,这种 \(\ce{^{99g}Tc}\) 化学中常用的起始原料会转化为绿色配合物 \(\ce{((C4H9)4N)[^{99g}TcOCl4]}\)。
1.7 用离子或中性分子的化学式写出氧化和还原两个半反应,以及完整的氧化还原反应。
临床使用的所有 \(\ce{^{99m}Tc}\) 放射性示踪剂均使用商业化试剂盒,通过“一锅法”反应制备。通常(\(\ce{^{99m}Tc}\) \(t_{1/2}=6.015\ \mathrm{h}\)),\(\ce{^{99m}Tc}\) 发生器的淋洗液具有 12.5 GBq 的活度(GBq = 吉贝可勒尔 = 每秒 \(10^9\) 次衰变)。
1.8 计算这样的样品中含有多少摩尔的 \(\ce{^{99m}Tc}\)。
常规成像时,向患者施用约 200 MBq 的 \(\ce{^{99m}Tc}\)。
1.9 假设没有活度因排泄而损失。计算患者需要等待多少小时,注入的活度才会降至初始活度的 1 % 以下。
放射性金属的生物偶联是一项化学挑战。最近的一个例子是 \(\ce{[^{99m}TcO3(tacn)]+}\)(A)(tacn = 1,4,7-三氮杂环壬烷)与烯烃的 (3 + 2) 环加成反应。这里的 (3 + 2) 指参与反应的原子数,而非电子数。下列反应示意图以标记一种受保护的糖类为例,展示了这一反应。
1.10 画出化合物 A 和 B 的结构。此外,指出这些化合物中锝的氧化态。
题目译自官方英文原文。
题目 2:CO2 的电化学还原
\(\ce{CO2}\) 的电化学还原
近年来,将 \(\ce{CO2}\) 电化学转化为高附加值产物被认为是一种具有前景且技术上可行的方法,可缓解大气中 \(\ce{CO2}\) 含量不断升高所造成的负面气候影响。为实现这一目标,人们已开发了多种技术。其中,通过电化学手段还原 \(\ce{CO2}\)(\(\ce{CO2}\)RR)尤其值得关注,因为这一过程能够利用可再生能源,将对环境有害的 \(\ce{CO2}\) 转化为平台化学品。电催化剂不仅对于加快本征反应速率缓慢的 \(\ce{CO2}\)RR 至关重要,还能使电解反应朝着生成目标产物的方向进行。在这一过程中,决定 \(\ce{CO2}\)RR 最终产物分布的不仅是催化剂本身的化学性质,还有其在不同尺度上的形貌特征。一种新的 \(\ce{CO2}\)RR 催化剂设计理念是通过电沉积制备泡沫状材料,这类材料具有较大的表面积,可供反应物(例如 \(\ce{H2O}\)、\(\ce{H2}\) 和 \(\ce{CO2}\))接触。铜基材料是目前已知唯一能够通过 \(\ce{CO2}\) 电解生成可观数量的烃和醇的金属 \(\ce{CO2}\)RR 催化剂。
以下给出若干物质的热力学数据:
\(\Delta_\mathrm{f}H^\ominus\)(\(\mathrm{kJ\,mol^{-1}}\)) \(S^\ominus\)(\(\mathrm{J\,K^{-1}\,mol^{-1}}\)) \(\ce{H2O(l)}\) −285.83 69.95 \(\ce{O2(g)}\) 0 205.15 \(\ce{H2(g)}\) 0 130.68 \(\ce{CO2(g)}\) −393.52 213.79 乙醇(l) −276.00 159.86 正丙醇(l) −302.54 192.80 表 1. 标准条件(\(T=298.15\ \mathrm{K}\)、\(p^\ominus=1\ \mathrm{bar}\))下若干物质的标准生成焓 \(\Delta_\mathrm{f}H^\ominus\) 和标准熵 \(S^\ominus\)
电池反应 相对于 SHE 的 \(E^\ominus\) (V) \(\ce{Cu^2+ + 2e- = Cu}\) +0.34 \(\ce{2H+ + 2e- = H2}\) 0.00 表 2. 标准条件下若干半电池反应及其标准电势
2.1 写出并配平酸性环境中下列电化学还原过程的半电池反应方程式:(i) \(\ce{CO2}\) 还原为乙醇;(ii) \(\ce{CO2}\) 还原为正丙醇。
2.2 将上述还原过程的半电池与一个 \(\ce{H2}/\ce{2H+}\) 半电池组成电池,后者作为阳极。计算 \(\ce{CO2}\) 还原为乙醇时的标准电池电势。
2.3 分别写出阴极和阳极上发生的所有还原及氧化半电池反应。
图 1 展示了动态氢气气泡模板法金属沉积的原理。
图 2 展示了在不同时间(5 s、20 s、80 s)中断金属沉积后获得的五种不同 \(\ce{Cu}\) 泡沫的俯视扫描电子显微镜图像。
\(\ce{Cu}\) 泡沫的电沉积过程(见图 1)在 1.5 M 硫酸水溶液中进行,其中含有 0.2 M 硫酸铜(\(\ce{CuSO4 * 5H2O}\))作为铜源。以 \(\ce{Cu}\) 圆盘(\(1\ \mathrm{cm^2}\))和 \(\ce{Pt}\) 箔分别作为阴极和阳极。
图 1. 泡沫状材料电沉积过程示意图。在水介质中以高电流密度进行金属电沉积(黑色箭头)时,金属(\(\ce{Cu}\))基底上发生析氢反应(HER)(1)。因此,表面被 \(\ce{H2}\) 气泡部分覆盖 (2)。\(\ce{H2}\) 气泡充当金属沉积的模板 (3)。最终形成高度多孔的金属泡沫 (4)
图 2. 在电流密度为 \(j=-3\ \mathrm{A\,cm^{-2}}\) 的恒电流条件下,通过 \(\ce{Cu}\) 电沉积获得的 \(\ce{Cu}\) 泡沫。各次沉积分别在经过不同时间后中断:5 s、20 s 和 80 s。所有子图的比例尺均相同
2.4 根据上述机理,在答题纸上为图 2 所示的 \(\ce{Cu}\) 泡沫标注正确的沉积时间(左上角白框)。
双金属 \(\ce{CuAg}\) 体系是由 \(\ce{CO2}\) 电合成醇的优良催化剂。在电流密度为 \(j=-3\ \mathrm{A\,cm^{-2}}\) 的恒电流条件下,持续沉积 20 s,将 5.4 mg 双金属 \(\ce{Cu}\)-\(\ce{Ag}\) 泡沫催化剂(90 wt. % \(\ce{Cu}\),\(M_{\ce{Cu}}=63.546\ \mathrm{g\,mol^{-1}}\);10 wt. % \(\ce{Ag}\),\(M_{\ce{Ag}}=107.868\ \mathrm{g\,mol^{-1}}\))沉积到 \(\ce{Cu}\) 箔(\(1\ \mathrm{cm^2}\))上(负号表示还原/阴极过程)。
2.5 计算该金属沉积过程的法拉第效率(FE,以 % 表示)。FE 定义为 \((Q_\mathrm{product}/Q_\mathrm{total})\times100\%\),其中 \(Q\) 表示电荷量。
考虑在 35 mL 经 \(\ce{CO2}\) 饱和的 0.5 M \(\ce{KHCO3}\) 电解质溶液中,使用双金属 \(\ce{Cu}\)-\(\ce{Ag}\) 泡沫催化剂(90 wt. % \(\ce{Cu}\);10 wt. % \(\ce{Ag}\))进行的 \(\ce{CO2}\) 电解实验。\(\ce{CO2}\) 电解在恒定的(总)电流密度 \(j(\mathrm{tot})=-30\ \mathrm{mA\,cm^{-2}}\) 下进行 3600 s(注意,电流密度以 \(1\ \mathrm{cm^2}\) 的几何表面积归一化;负号表示还原/阴极过程)。电解后的产物分析表明,乙醇和正丙醇的质量浓度分别为 \(41.3\ \mathrm{mg\,L^{-1}}\) 和 \(7.4\ \mathrm{mg\,L^{-1}}\)。这两种醇均为液态反应产物,在电解反应过程中积累于电解质溶液中。假设该过程中生成的唯一副产物为氢气(\(\ce{H2}\))。
2.6 假设电流密度不随电解时间变化,计算生成 (a) 乙醇(\(M_\mathrm{EtOH}=46.08\ \mathrm{g\,mol^{-1}}\))和 (b) 正丙醇(\(M_\mathrm{PrOH}=60.10\ \mathrm{g\,mol^{-1}}\))所需的电流密度。
2.7 计算在 \(1\ \mathrm{cm^2}\) 催化剂面积上生成的氢气在 298.15 K 和 1 bar 下的体积,假设生成的氢气符合理想气体行为,并完全释放至气相。若你未能求得第 2.6 题的结果,请使用 FE(EtOH) = 45,1 % 和 FE(PrOH) = 4.8 % 继续计算。
题目译自官方英文原文。
题目 3:人工光合作用
人工光合作用研究旨在将太阳能储存在化学键中。敏化剂吸收光子后被激发,从而产生电荷分离态。激发态电子转移至催化剂(析氢催化剂,HEC),催化剂经两次还原后生成 \(\ce{H2}\)。光敏剂或光吸收体通常为 \(\ce{[Ru(bpy)3]^2+}\)(bpy = 2,2'-联吡啶),而析氢催化剂通常为钴配合物。
水分解的能量学
3.1 计算反应 \(\ce{H2 -> 2H+(aq) + 2e-}\) 的焓变。
质子的溶剂化焓:\(\Delta_{\mathrm{aq}}H(\ce{H+})=-1190\ \mathrm{kJ\,mol^{-1}}\)
氢的电离能:\(IE_1=13.6\ \mathrm{eV}\)
\(\ce{H2}\) 的解离焓:\(\Delta_{\mathrm{diss}}H(\ce{H2})=432\ \mathrm{kJ\,mol^{-1}}\)
理想情况下,水电化学分解为 \(\ce{O2}\) 和 \(\ce{H2}\) 所需的电压为 1.23 V。由于该过程的 \(T\Delta S\) 为正,因此需要从环境中吸收热量。如果额外施加的电压所产生的热量能够补偿温度下降,则该过程称为热中性过程。\(\ce{H2O}\) 的生成焓 \(\Delta_{\mathrm f}H^\circ(\ce{H2O})\) 为 \(-285\ \mathrm{kJ\,mol^{-1}}\)。
3.2 计算 (a) 25 °C 下 1 mol \(\ce{H2O}\) 分解反应的熵变 \(\Delta_{\mathrm r}S^\circ\),以及 (b) 水分解达到热中性时的电压。
催化剂
钴–salen(salcomin)型配合物是由质子和电子生成 \(\ce{H2}\) 的潜在催化剂。salcomin 的结构如下:
图 1. salcomin 的结构
3.3 确定 salcomin 中钴原子的氧化态。从以下三种可能的构型中,确定 salcomin 中钴中心周围的几何构型:四面体、平面正方形或八面体。
在溶液中,salcomin 可以结合 \(\ce{O2}\);\(\ce{O2}\) 通过与两个 Co 中心配位,将两个 salcomin 单元连接起来。此时两个 Co 中心的氧化态均为 +III。
3.4 画出所形成的结构。
\(\ce{H2}\) 的生成仅发生在钴中心。该反应可用一个从 \(\ce{Co^2+}\) 开始、消耗 2 个 \(\ce{H+}\) 和 2 个电子的四步催化循环来描述。其中一步通过分子内电子转移形成氢化物。
3.5 写出两种可能的催化循环,标明配合物的电荷和 Co 中心的氧化态。Co 中心的氧化态不得高于 +III。用星号标出氢化物形成的步骤,并用 C(化学反应)标记摄取 \(\ce{H+}\) 的步骤,用 E(电化学反应)标记摄取电子的步骤,参见下方图 2 中的示例循环。\(\ce{[Co^{II}]}\) 代表钴–salen 配合物。
图 2. 第 3.5 题的示例循环
3.6 利用表 1 中给出的不同钴配合物的氧化还原电势,写出适用于 a) 中性 pH 下水的氧化和 b) 中性 pH 下水的还原的配合物。分别写出这两个过程相应的总反应(仅针对能够进行该过程的配合物),并计算中性 pH 下的电池电势。在 pH = 7、\(T=298\ \mathrm K\) 时,质子还原的半电池电势为 \(-0.41\ \mathrm V\)。
Co(III/II) 氧化还原电对 相对于标准氢电极的 \(E^\circ\) \(\ce{[Co(H2O)6]}^{3+/2+}\) \(+1.92\ \mathrm V\) \(\ce{[Co(C2O4)3]}^{3-/4-}\) \(+0.55\ \mathrm V\) \(\ce{[Co(EDTA)]}^{1-/2-}\) \(+0.38\ \mathrm V\) \(\ce{[Co(NH3)6]}^{3+/2+}\) \(+0.06\ \mathrm V\) \(\ce{[Co(en)3]}^{3+/2+}\) \(-0.18\ \mathrm V\) \(\ce{[Co(CN)5]}^{2-/3-}\) \(-0.60\ \mathrm V\) 表 1. 第 3.6 题中可能使用的氧化还原电对;\(\ce{[C2O4]^2-}\) = 草酸根,en = 1,2-乙二胺。
自然过程一瞥
生物体内 \(\ce{H2}\) 当量的天然储存形式是 NADPH,它由 \(\ce{NADP+}\) 加成一个氢负离子而生成。NADPH 的结构见图 3。
图 3. NADPH 的结构
3.7 画出 \(\ce{NADP+}\) 的结构。
叶绿素在 680 nm 处的摩尔消光系数约为 \(\varepsilon=8\times10^4\ \mathrm{M^{-1}\,cm^{-1}}\)。
3.8 假设在 680 nm、光子通量为 \(100\ \mathrm{nE\,s^{-1}\,cm^{-2}}\)(1 E = 1 mol 光子)的条件下,效率(光子转化为氢原子)为 \(\phi=20\ \%\),计算 a) 每秒所需的光子数,以及 b) 在一个 \(1\times1\times1\ \mathrm{cm^3}\) 的池中,要达到 \(1\ \mathrm{nmol}\ (\ce{H2})\ \mathrm{s^{-1}}\) 的周转频率所需的叶绿素浓度。
题目译自官方英文原文。
题目 4:含氟化合物与超价化合物
氟几乎能与所有元素形成稳定且可分离的化合物,包括稀有气体 \(\ce{Kr}\) 和 \(\ce{Xe}\)。含氟分子常具有不常见的结构。因此,氟经常参与形成含有第 14–18 族元素的化合物,这些化合物被定义为超价化合物。如今,含氟有机化合物的合成在很大程度上依赖于专门设计的试剂的可获得性,下面的化合物 4 就是一个例子。
提示:\(\mathbf{E^1}\)–\(\mathbf{E^8}\) 系列中的任一元素 \(E\) 都可以出现多次。
部分 I. 分子几何构型
4.1 确定三种物种 1、\(\mathbf{[2]^-}\) 和 \(\mathbf{[3]^-}\) 中的元素 \(\mathbf{E^1}\)、\(\mathbf{E^2}\)、\(\mathbf{E^3}\) 和 \(\mathbf{E^4}\)。
1:中性、非两性离子分子,\(\mathbf{E^1}\) 为四方锥形,\(\mathbf{E^2}\) 为八面体形,平均 \(d(E^1\!-\!\ce{F})=1.91\ \text{Å}\);平均 \(d(E^2\!-\!\ce{F})=1.58\ \text{Å}\)
\(\mathbf{[2]^-}\):阴离子,四方锥形,平均 \(d(E^3\!-\!\ce{F})=1.96\ \text{Å}\)
\(\mathbf{[3]^-}\):阴离子,平面五边形,\(d(E^4\!-\!\ce{F})=1.98\ \text{Å}\)
提示:
- 分子几何构型指与 \(E^1\)–\(E^4\) 成键的原子的空间排列
- 1 的元素分析结果表明,其碳的质量分数为 17.75 %。
第 15 族 第 16 族 第 17 族 第 18 族 \(d(\ce{P-F})=1.50\text{–}1.68\ \text{Å}\) \(d(\ce{S-F})=1.52\text{–}1.60\ \text{Å}\) \(d(\ce{Cl-F})=1.63\text{–}1.85\ \text{Å}\) \(d(\ce{As-F})=1.68\text{–}1.72\ \text{Å}\) \(d(\ce{Se-F})=1.75\text{–}1.80\ \text{Å}\) \(d(\ce{Br-F})=1.77\text{–}1.97\ \text{Å}\) \(d(\ce{Kr-F})=1.77\text{–}1.89\ \text{Å}\) \(d(\ce{Sb-F})=1.85\text{–}2.05\ \text{Å}\) \(d(\ce{Te-F})=1.80\text{–}2.00\ \text{Å}\) \(d(\ce{I-F})=1.90\text{–}2.00\ \text{Å}\) \(d(\ce{Xe-F})=1.77\text{–}2.00\ \text{Å}\) 表 1. 第 15–18 族部分元素的典型 \(\ce{E-F}\) 键长范围
4.2 分别选择哪些元素 \(\mathbf{E^5}/\mathbf{E^6}\) 和 \(\mathbf{E^7}/\mathbf{E^8}\) 能呈现给定的几何构型,且其 \(\ce{E-F}\) 键长接近 1 中的键长(见表 1)。
部分 II. 反应性与结构
考虑下图所示的反应:
4.3 根据 \(\ce{Te}\) 原子周围价层电子对域的排列,选择化合物 6 的理想几何构型:
- 平面正方形
- 四方锥形
- 三角双锥形
- 四面体形
- 八面体形
给出预期的理想键角 \(C^1\!-\!\ce{Te}\!-\!\ce{I}\)、\(C^2\!-\!\ce{Te}\!-\!\ce{I}\)、\(\ce{I-Te-O}\) 和 \(C^1\!-\!\ce{Te}\!-\!C^2\)。
4.4 分别写出化合物 4 和 6 中两个甲基预期产生的 \({}^{1}\mathrm{H}\)-NMR 信号数。
4.5 化合物 6 依次与 \(\ce{AgF}\) 和 \(\ce{(H3C)3SiCF3}\)(\(\ce{TMSCF3}\))反应。写出含 \(\ce{Te}\) 的中间体 A 和最终产物 B,包括其正确的几何构型,以及副产物 C 和 D。画出 A 和 B,并写出副产物 C 和 D。提示:D 的分子量为 \(92.08\ \mathrm{g\,mol^{-1}}\)。
假设化合物 6 与一种空间位阻大、具有手性且为对映体纯的路易斯酸反应,例如已知的硼衍生物 8,如下图所示。该反应应生成新产物 9,其组成对应于 6 与 8 的组成之和。进一步假设 9 是一种盐,其中阳离子源自 6,阴离子源自 8。
4.6 画出含 \(\ce{Te}\) 阳离子和含硼阴离子的结构,并根据 \(\ce{Te}\) 原子周围价层电子对域的排列,选择阳离子的理想几何构型。
提示:对于 8(具有手性且为对映体纯),使用以下示意表示:
选择阳离子的理想分子几何构型:
- 平面正方形
- 平面三角形
- 三角锥形
- 三角双锥形
- 四面体形
4.7 指出可能存在的立体化学不同的盐 9 的数目。
部分 III. \(\lambda^3\)-二氟碘烷的合成与单键旋转
如下图所示,在干燥乙腈中、过量 \(\ce{KF}\) 存在下,用三氯异氰尿酸(TCICA,9)氧化起始原料 8,制得化合物 10。
4.8 写出该过程配平的半反应方程式和配平的总反应方程式。
提示:将 10 简写为 \(\ce{R-I}\),11 简写为 \(\ce{R-IF2}\),TCICA 简写为 \(\ce{C3Cl3N3O3}\)。TCICA 的六元环在还原时保持完整。
12 中的 \(\ce{IF2}\) 基团可以绕 \(\ce{I-C}\) 键旋转(想象一个分子螺旋桨)。相应的旋转势垒已通过实验测得,为 \(E_\mathrm{a}=30\ \mathrm{kJ\,mol^{-1}}\)。此外,在 \(228\ \mathrm{K}\) 时,旋转的速率常数为 \(k=2500\ \mathrm{s^{-1}}\)。
4.9 确定原则上 \(\ce{IF2}\) 基团在室温(\(298\ \mathrm{K}\))下能够以多快的速率旋转。将这一过程视为一个化学反应,求其速率常数。将答案写在答题纸上。该常数的单位应为 \(\mathrm{s^{-1}}\)。
题目译自官方英文原文。
题目 5:加氢脱硫
生产无硫燃料是减少对环境有毒害作用的含硫化合物排放的总体趋势。炼油厂采用氢气参与的加氢脱硫工艺来除去硫。
5.1 已知 A 和 B 是环状区域异构体,C 也是环状化合物,画出噻吩加氢脱硫产物 A 至 E 的结构。
图 1. 噻吩加氢脱硫过程
硫最常见的两种天然稳定同位素为 \(\ce{^{32}S}\) 和 \(\ce{^{34}S}\),其相对摩尔丰度分别为 \(x(\ce{^{32}S})=94.8\,\%\) 和 \(x(\ce{^{34}S})=4.37\,\%\)。氢的天然稳定同位素为 \(\ce{^{1}H}\) 和 \(\ce{^{2}H}\)(\(\ce{D}\)),其相对摩尔丰度分别为 \(x(\ce{^{1}H})=99.986\,\%\) 和 \(x(\ce{^{2}H})=0.014\,\%\)。
5.2 仅考虑上述同位素,列出 \(\ce{H2S}\) 的所有同位素体。
5.3 仅考虑上述同位素,列出同时含有 \(\ce{D}\) 和 \(\ce{^{34}S}\) 原子核的所有 \(\ce{H2S}\) 同位素体,并分别计算其相对摩尔丰度,以 % 表示。
脱硫是一种催化过程,通常使用负载于 \(\ce{SiO2}\) 上的 \(\ce{MoS2}\)(\(\ce{MoS2}/\ce{SiO2}\))催化剂。可采用同位素交换法研究催化剂表面。同位素交换反应发生在气固界面,仅使表面原子发生交换。在一级近似下,体相原子不参与交换(图 2)。
实验中,在流动反应器内研究了 \(\ce{MoS2}/\ce{SiO2}\) 催化剂(Mo 的质量分数为 \(w_{\mathrm{Mo}}=4.280\,\%\),最初仅含 \(\ce{^{32}S}\))与气态同位素标记的 \(\ce{H2^{34}S}\) 之间的同位素交换(图 2)。将 \(\ce{MoS2}/\ce{SiO2}\) 催化剂(\(m_{\mathrm{cat}}=1.2350\,\mathrm{g}\))置于含有 \(\ce{H2^{34}S}\)、以 \(\ce{Ar}\) 为平衡气的混合气流中(\(p=1.00\,\mathrm{bar}\)、\(v=20.0\,\mathrm{mL\,min^{-1}}\)、\(T=23.0\,^\circ\mathrm{C}\);体积分数 \(\varphi(\ce{H2^{34}S})=1.00\,\%\),\(\ce{^{34}S}\) 的同位素纯度 \(\alpha=99.95\ \text{mol.}\,\%\))。实验持续时间为 \(t=10.0\,\mathrm{min}\),并在整个实验过程中收集出口气体。测得所收集气相中硫原子所含 \(\ce{^{34}S}\) 同位素的分数(\(\gamma\))为 \(\gamma=87.3\ \text{mol.}\,\%\)。假设气体遵循理想气体行为,表面与体相中 \(\ce{MoS2}\) 的元素组成(不是同位素组成!)相同,且在实验结束时,表面的所有硫原子均已与气相发生交换。
图 2. 实验进行中(A)和最终阶段(B)的示意图。表面硫原子以红色表示,体相硫原子以蓝色表示。图中未画出钼原子。
5.4 计算发生交换的硫原子的物质的量 \(n(\ce{S})_{\mathrm{surface}}\),以 mol 表示。
如果你未能算出发生交换的硫原子的物质的量,请在以下所有计算中使用数值 \(1.53\times10^{-5}\,\mathrm{mol}\)。
假设 \(\ce{MoS2}\) 相由大小均一的球形颗粒组成,在实验结束时,位于表面的所有硫原子均已发生交换,而体相原子未参与交换反应。\(\ce{MoS2}\) 的密度为 \(\rho=5.06\,\mathrm{g\,cm^{-3}}\),表面上 \(\ce{S}\) 和 \(\ce{Mo}\) 原子平均占据的面积分别为 \(A_{\mathrm{S}}=3.00\times10^{-19}\,\mathrm{m^2}\) 和 \(A_{\mathrm{Mo}}=5.00\times10^{-19}\,\mathrm{m^2}\)。半径为 \(R\) 的球的表面积可由 \(S=4\pi R^2\) 计算,体积可由 \(V=(4/3)\pi R^3\) 计算。假设同位素组成不影响 \(\ce{MoS2}\) 的密度。
5.5 计算 \(\ce{MoS2}\) 颗粒的半径 \(R\)。答案以 nm 表示。
实际上,表面经同位素标记的原子会向体相扩散,而体相中未标记的原子会迁移至表面,逐渐发生交换(图 3A)。因此,在某一给定时刻,颗粒内标记原子的分数从颗粒表面向中心逐渐减小。同时,随着交换时间延长,参与交换反应的体相原子增多,如图 3B 所示。
图 3. A) \(\ce{MoS2}\) 颗粒中硫同位素从表面向体相扩散的示意图。表面硫原子以红色表示,体相硫原子以蓝色表示。图中未画出钼原子。B) 体相中 \(\ce{^{34}S}\) 原子的分数随时间和距颗粒中心距离的变化;\(r_{\mathrm{edge}}\) 对应于 \(\ce{MoS2}\) 颗粒的半径。
实验结束时,表面原子已完全发生交换,此外还有一部分体相原子通过扩散发生交换。发生交换的体相硫原子的物质的量 \(n(\ce{S})_{\mathrm{bulk}}^{\mathrm{ex}}\) 占体相硫原子总物质的量 \(n(\ce{S})_{\mathrm{bulk}}^{\mathrm{total}}\) 的分数可按下式计算:
\[ F=n(\ce{S})_{\mathrm{bulk}}^{\mathrm{ex}}/ n(\ce{S})_{\mathrm{bulk}}^{\mathrm{total}} =1-\exp(-Dt/R^2) \]
其中,\(t\) 为交换实验的时间(如上所述),\(R\) 为颗粒半径,\(D\) 为扩散系数。采用电子显微镜对上述催化剂进行了独立研究,结果表明,\(\ce{MoS2}\) 颗粒为均匀分布的球体,半径为 \(35.0\,\mathrm{nm}\)。
5.6 使用 \(R=35.0\,\mathrm{nm}\) 和上述交换实验的数据,计算扩散系数 \(D\)(单位为 \(\mathrm{m^2\,s^{-1}}\)),它描述硫原子在 \(\ce{MoS2}\) 中的扩散。计算时,使用近似式 \(e^x\approx1+x\),该式在 \(x\ll1\) 时成立。
题目译自官方英文原文。
题目 6:甲烷直接转化为甲醇
甲烷广泛存在于天然气中,因此是化学工业中一种很有吸引力的原料,例如可用于生产甲醇。然而,由于甲醇比甲烷更容易被氧化,这一过程的控制颇具挑战性。化学循环过程可以避免过度氧化:铜离子交换沸石催化剂的活性位点仅提供氧化生成甲醇所需的单个氧原子,并在此过程中被消耗。在第二步中,催化剂在不存在甲烷的条件下用氧气再生。下图展示了两种可能的催化铜位点。反应过程中,Cu(II) 被还原为 Cu(I)。
6.1 给出将一个甲烷分子氧化为甲醇所需的 S1 位点数和 S2 位点数。
在不存在氧气的条件下,生成的甲醇不会从沸石上脱附。如果反应在体积和温度恒定的容器(高压釜)中进行,则压力下降仅由甲烷的消耗引起,且可将甲烷视为理想气体。在一个 1 L 的高压釜中,装有 200 mg 铜负载量为 4.3 %(质量分数)的沸石;在 528 K 下反应完成后,甲烷压力由初始的 \(p_0 = 933\ \mathrm{Pa}\) 降至 \(p_\infty = 925\ \mathrm{Pa}\)。
6.2 计算发生反应的铜的百分比。
6.3 实验数据绘于图 1。据此判断 \(\ce{CH4}\) 氧化反应的(准)级数。
(a) 该反应为(准)零级反应。
(b) 该反应为(准)一级反应。
(c) 该反应为(准)二级反应。
图 1. 在不同温度下,甲烷在高压釜中与含有 S1 和 S2 位点的载铜沸石反应时,归一化甲烷压力随时间变化的半对数图。符号表示实验数据点。实线是对适当时间范围内的数据进行的线性拟合。点线用于辅助读图
6.4 写出在给定条件下与实验数据一致的 \(\ce{CH4}\) 氧化反应的(准)速率方程。注意,它可能取决于 \(\ce{CH4}\) 以及 S1 和 S2 位点的浓度,还取决于速率常数。
6.5 选出正确的陈述。
(a) 至少有两种类型的铜位点参与反应,各自具有不同的速率常数。
(b) 温度越高,沸石氧化甲烷的总反应越快。
(c) 温度越高,反应完成后与甲烷发生反应的铜位点所占比例越大。
(d) 其中一个反应在较高温度下变慢。
顺磁性的 S1 位点可通过电子顺磁共振(EPR)波谱观测,而抗磁性的 S2 位点不产生 EPR 信号。EPR 波谱测量的是电子自旋数。因此,S1 位点数与 EPR 谱的二次积分 \(I_2\) 成正比,即 \([\mathbf{S1}] \propto I_2\)。在不同温度 \(T\) 下测量了波谱,并且在每个温度下,均在反应开始后的不同时间 \(t\) 进行了测量。
6.6 推导将 \(I_2(t)\) 与 S1 位点消耗的速率常数联系起来、且对时间呈线性关系的方程。
6.7 对于以下各项测量,在答题纸上勾选需要用已知 Cu(II) 标准样品进行校准的项目。
(a) 样品中顺磁性 Cu(II) 位点的总数。
(b) 样品中顺磁性 Cu(II) 位点的浓度。
(c) 速率常数。
(d) 样品中不同顺磁性 Cu(II) 物种的类型。
由 EPR 测量可知,528 K 下与 S1 位点反应的速率常数为 \(2.604 \times 10^{-3}\ \mathrm{s^{-1}}\)。
6.8 结合图 1,通过计算判断甲烷与 S2 位点的反应比与 S1 位点的反应更快还是更慢。
(a) 甲烷与 S1 的反应更快。
(b) 两者的反应速率相同。
(c) 甲烷与 S2 的反应更快。
使用不同的沸石催化剂,可将甲醇进一步转化为高价值的烯烃。在这一过程中,观测到一种中间产物,其摩尔质量为 \(86.09\ \mathrm{g\,mol^{-1}}\),元素分析结果为(\(\ce{C}\) 的质量分数为 55.8 %,\(\ce{H}\) 的质量分数为 7.0 %),其 \({}^{1}\mathrm{H}\) NMR 谱在四个不同化学位移处出现信号:
a: 12.2 ppm(1H,s),宽峰,加入 \(\ce{D2O}\) 后消失
b: 6.3 ppm(1H,d)
c: 5.7 ppm(1H,d)
d: 2.0 ppm(3H,s)
6.9 画出该中间产物的结构,并对质子 a 和 d 进行归属。
美国能源部将十二种仅含 \(\ce{C}\)、\(\ce{H}\) 和 \(\ce{O}\) 的化合物列为平台化学品。它们是最有前景的候选物,易于由可再生资源制备,并可用于制备多种目标衍生物。其中之一是化合物 A,它既可进一步衍生化,也可用于例如医药或洗涤剂等用途。
- 在 DMSO 中测得的 \({}^{1}\mathrm{H}\) NMR:7.81 ppm(a,s),13.0 ppm(b,s,宽峰,加入 \(\ce{D2O}\) 后消失),两个信号的积分相同。
- \({}^{13}\mathrm{C}\) NMR:165.1 ppm(1)、150.6 ppm(2)和 120.6 ppm(3)。
- \(M = 156.03\ \mathrm{g\,mol^{-1}}\)。元素分析:\(\ce{C}\) 的质量分数为 46.15 %,\(\ce{H}\) 的质量分数为 2.56 %。
6.10 给出 A 的一种可能结构,并对所有质子及碳 1 进行归属。
题目译自官方英文原文。
题目 7:酶动力学
1913 年提出的米氏(Michaelis–Menten,MM)机制描述了酶催化反应的动力学。在该机制中,酶 \(\ce{E}\) 催化底物 \(\ce{S}\) 转化为产物 \(\ce{P}\):
遵循 MM 机制的酶促反应的初始速率由下式给出
\[ v_0=v_{\max}\frac{[\ce{S}]_0}{K_{\mathrm M}+[\ce{S}]_0} \tag{1} \]
其适用条件是 \(\ce{E}\) 的初始浓度远低于 \(\ce{S}\) 的初始浓度,即 \([\ce{E}]_0\ll[\ce{S}]_0\)。米氏常数定义为 \(K_{\mathrm M}=(k_2+k_3)/k_1\)。初始速率也可以表示为相对通量 \(j\) 与 \([\ce{E}]_0\) 的乘积:
\[ v_0=j[\ce{E}]_0 \tag{2} \]
注意:第 7.1 和 7.2 题可能有一个、多个或没有正确选项。
7.1 选出初始速率(\(v_0\))表达式 (1) 和 (2) 的正确等价形式。
\([\ce{ES}]_{\max}\) 为 \(\ce{ES}\) 复合物的最大浓度。
- (a) \(\displaystyle v_0=\frac{k_3[\ce{E}]_0[\ce{S}]_0}{K_{\mathrm M}+[\ce{S}]_0}\)
- (b) \(\displaystyle v_0=\frac{k_3[\ce{E}]}{K_{\mathrm M}/[\ce{S}]_0+1}\)
- (c) \(\displaystyle v_0=j[\ce{ES}]_{\max}\)
- (d) \(\displaystyle v_0=\frac{k_3[\ce{E}]_0[\ce{ES}]_{\max}}{K_{\mathrm M}+[\ce{S}]_0}\)
- (e) \(\displaystyle v_0=\frac{k_3[\ce{E}]_0}{K_{\mathrm M}/[\ce{S}]_0+1}\)
- (f) \(\displaystyle v_0=\frac{j[\ce{E}]_0}{K_{\mathrm M}+[\ce{S}]_0}\)
7.2 选出预期能得到直线图的坐标轴组合(\(y\) 对 \(x\))。
- (a) \(v_0\) 对 \(1/[\ce{S}]_0\)
- (b) \(v_0\) 对 \(v_0/K_{\mathrm M}\)
- (c) \(v_0\) 对 \(K_{\mathrm M}/v_0\)
- (d) \(1/v_0\) 对 \(v_0/[\ce{S}]_0\)
- (e) \(1/v_0\) 对 \(v_0/K_{\mathrm M}\)
- (f) \([\ce{S}]_0/v_0\) 对 \([\ce{S}]_0\)
许多酶催化的是多底物转化,而非单底物转化。然而,如果一种底物的浓度远高于另一种底物的浓度,或其浓度保持恒定,米氏动力学也适用。下面将考察两个彼此独立且遵循米氏动力学的酶促反应体系。
酶促反应体系 I
酶 \(\ce{E}\) 将底物 \(\ce{A}\) 和 \(\ce{B}\) 转化为产物 \(\ce{P_A}\) 和 \(\ce{P_B}\)。当游离酶与所有酶–底物复合物之间达到快速预平衡时,下式成立:
\[ v_0= \frac{k[\ce{E}]_0[\ce{A}]_0[\ce{B}]_0} {(K+[\ce{A}]_0)(K+[\ce{B}]_0)} \tag{3} \]
其中,\(k\) 为其中一个反应的速率常数。两种底物从 \(\ce{E}\) 各自相应的活性位点解离时,具有相同的平衡常数 \(K\)。
7.3 证明:若底物 \(\ce{B}\) 的浓度保持为恒定值 \(c_0\),则式 (3) 具有米氏方程 (1) 的形式。给出此时 \(v_{\max}\) 的表达式。
7.4 为酶促反应体系 I 提出一个与式 (3) 一致的动力学反应示意图,标出所有中间体和产物。指出速率常数为 \(k\) 的反应。
酶促反应体系 II
酶 \(\ce{E}\) 具有五个活性位点,每个位点均对底物 \(\ce{S_A}\)、\(\ce{S_B}\) 或 \(\ce{S_C}\) 中的一种具有专一性,并分别将其选择性地转化为产物 \(\ce{P_A}\)、\(\ce{P_B}\) 或 \(\ce{P_C}\)。每种底物至少对应一个活性位点。各活性位点彼此独立。
关于 \(\ce{E}\),已知:
-
其对 \(\ce{S_C}\) 的亲和力高于对 \(\ce{S_B}\) 的亲和力。
-
对于 \(\ce{S_A}\)、\(\ce{S_B}\)、\(\ce{S_C}\),以每个活性位点的速率(\(v_{0i}\))作 \(v_{0i}\) 对 \(v_{0i}/[\ce{S_i}]_0\) 的图,称为 Eadie–Hofstee 图,如下所示,但省略了刻度和图例。
-
当 \(\ce{E}\) 被 \(\ce{S_A}\)、\(\ce{S_B}\)、\(\ce{S_C}\) 饱和时,每个位点对 \(\ce{S_C}\) 的催化转换数(TON)为 \(10200\ \mathrm{min^{-1}}\),且每秒共合成 2023 个产物 \(\ce{P_A}\)、\(\ce{P_B}\)、\(\ce{P_C}\) 分子。同时,检测到每小时生成的 \(\ce{P_A}\) 和 \(\ce{P_B}\) 分子总数不超过 \(5.94\times10^6\)。
-
当 \(\ce{S_A}\)、\(\ce{S_B}\)、\(\ce{S_C}\) 的摩尔浓度相等,且均不高于各自对应的 \(K_{\mathrm M,i}\) 值的千分之一时,\(\ce{P_A}\)、\(\ce{P_B}\)、\(\ce{P_C}\) 的浓度与催化效率 \((\varepsilon_i=k_{i3}/K_{\mathrm M,i})\) 成正比,三者的浓度比依次为 \(3:2:5\)。
-
有两种 \(\ce{ES_i}\) 复合物解离为 \(\ce{E}\) 和 \(\ce{S_i}\) 的速率常数相等。\(\ce{ES_C}\) 转化为初始反应物的反应活化能垒比转化为最终产物的高 \(1266\ \mathrm{J\,mol^{-1}}\)。假设这两个反应的指前因子相等,且 \(T=25\,^\circ\mathrm C\)。
-
对于 \(\ce{E + S_i}\) 反应:\(k_{\mathrm{c1}}=1.57\times10^7\ \mathrm{M^{-1}\,s^{-1}}\),且 \(k_{\mathrm{a1}}=k_{\mathrm{b1}}\)。
7.5 填写下表,并给出计算过程。提示:
- 利用第 1 和第 2 点的信息,确定常数 \(K_{\mathrm M,A}\)、\(K_{\mathrm M,B}\) 和 \(K_{\mathrm M,C}\) 之间的关系(\(<\)、\(>\)、\(=\))。
- 第 3 和第 5 点的信息可用于填完表中的第一列(每种底物对应的活性位点数)和最后一行(底物 \(\ce{S_C}\) 的所有常数)。检查活性位点总数是否等于 5。
活性位点数 \(k_1\) \(k_2\) \(k_3\) \(K_{\mathrm M}\) \(\ce{S_A}\) \(\ce{S_B}\) \(\ce{S_C}\) \(1.57\times10^7\ \mathrm{M^{-1}\,s^{-1}}\) 题目译自官方英文原文。
题目 8:纳扎罗夫反应
纳扎罗夫反应是一种常用的由二乙烯基酮生成环戊烯酮的反应。该反应可在光照或酸催化条件下进行,其过程为电环化,随后发生质子转移。
8.1 画出描述纳扎罗夫反应的 π 分子轨道。将电子填入相应的能级。在 (i) HOMO(最高占据分子轨道)和 (ii) LUMO(最低未占据分子轨道)处标上 x。本题中,可以将二乙烯基酮视为具有五个 p 轨道的戊二烯基正离子。
8.2 根据你在任务 8.1 中得到的 π 分子轨道,预测二乙烯基酮的纳扎罗夫反应在什么条件下以对旋或顺旋方式进行。在表中用 x 标出允许反应发生的条件。
对旋 顺旋 热反应 光化学反应 8.3 在法呢素的一条合成路线中,纳扎罗夫反应被用作关键反应。对于下列两种条件,分别画出 A 和 B 的一种可能结构,包括其立体化学。注意,两种反应的产物均在 \(\ce{^1H}\) NMR 谱的 6.70–6.73 ppm 处出现信号。
卡普烯的合成从下图所示的不饱和醛 C 开始。先用 D 处理,再与负载于碳上的 \(\ce{MnO2}\) 反应,得到下图所示的二乙烯基酮 E。用 \(\ce{P2O5}\) 和 MsOH 的混合物处理后得到 F,再经一系列反应将其转化为不饱和酮 I。
8.4 从下列选项中选出适合作为 D 的试剂。
(a) \(\ce{H2C=CHMgBr}\) (c) \(\ce{H2C=CHBr}\),\(\ce{Pd(PPh3)4}\)
(b) 1. \(\ce{NaBH4}\) 2. \(\ce{H2C=CHLi}\) (d) \(\ce{H2C=CHMgBr}\),\(\ce{CuI}\)
8.5 给出中间体 F、G 和 H 的结构,包括其立体化学。
随后,将烯酮 I 与 \(\ce{H2C=CHMgBr}\) 和 \(\ce{CuI}\) 在 THF 中反应,得到中间体 J,再经臭氧化分解得到中间体 K,其 \(\ce{^1H}\) NMR 谱在 9.61 ppm 处出现信号。在 THF 和乙醚的混合溶剂中用 5-% \(\ce{KOH}\) 处理,得到中间体 L。在 \(\ce{H2}\) 气氛中用 Pt 催化剂进行氢化,得到 M,最终由其制得卡普烯。
8.6 给出 J、K、L 和 M 的结构,包括其立体化学。
题目译自官方英文原文。
题目 9:有机合成中的电解
Kolbe 电解是指两个羧酸分子脱羧并二聚的反应,且只有在酸去质子化后才能进行。未配平的反应方程式如下。
反应过程中产生两种气体(B 和 C)。B 能与 \(\ce{Ca(OH)2}\) 反应,而 C 极易燃烧。
9.1 写出 A、B 和 C 的结构式。
9.2 该合成在形式上是氧化还原反应,其中羧酸根被氧化,溶剂被还原。写出氧化半反应、还原半反应以及总氧化还原反应方程式。
9.3 写出氧化脱羧及产物形成机理中的中间体 1 和 2。
Kolbe 电解通常仅对长链饱和羧酸有效,而不适用于某些羧酸,例如 D。在这种情况下,自由基中间体 E 更容易被进一步氧化为带正电荷的物种 F。中间体 F 可与亲核试剂反应,形成不同的副产物,例如与 D 反应生成酯 G,与 \(\ce{MeOH}\) 反应生成 H。
9.4 写出 D–H 的结构。
在过量共反应酸 J 存在下,电解羧酸 I 得到两种主要产物(经 \({}^{1}\mathrm{H}\) NMR 分析),它们无法通过硅胶色谱分离。两者的波谱数据几乎相同。在 \({}^{1}\mathrm{H}\) NMR 谱中,只能通过两个化学位移略有差异的信号来区分这两种物质。
\({}^{1}\mathrm{H}\) NMR 谱如下(产物 K 和 L 的 1:1 混合物):
4.18–4.08 (m, 4 H), 3.95–3.60 (m, 6 H), 3.43 (dt, 2 H, \(J=7.8,\ 2.2\ \mathrm{Hz}\)),
2.55–2.25 (m, 4 H), 2.20–1.95 (m, 2 H), 1.65–1.50 (m, 2 H)K 的特征信号:
1.26 (t, 3 H, \(J=7.2\ \mathrm{Hz}\)), 1.20 (d, 3 H, \(J=6.6\ \mathrm{Hz}\))
L 的特征信号:
1.24 (t, 3 H, \(J=7.2\ \mathrm{Hz}\)), 1.15 (d, 3 H, \(J=6.6\ \mathrm{Hz}\))
9.5 写出产物 K 和 L 的结构。指出这两种产物之间的关系。
(a) 差向异构体 (b) 对映异构体
(c) 非对映异构体 (d) 构造异构体
电极材料的选择会影响有机电合成反应的选择性。苯甲醛(M)的还原电解(在 1 M 的 \(\ce{KOH}\) 水溶液中,浓度为 16 mM,采用 \(\ce{Pt}\) 阳极,电位为相对于 \(\ce{Ag/AgCl}\) 的 −1.3 V)会因所用阴极材料不同而生成不同产物。与电极表面的强结合有利于分子间反应。下图给出了不同阴极材料下的产物分布以及产物的质谱。
9.6 写出 N 和 O 的结构。
烯烃(例如烯醇醚)可以发生氧化偶联。这通常涉及烯烃片段在阳极上被氧化,生成自由基阳离子,随后被亲核试剂捕获。
9.7 写出下列反应路线中 P、Q、R 和 S 的结构式。无需标明立体化学。提示: S 是一种三环产物。
题目译自官方英文原文。
题目 10:瑞士——制药之国
帕瑞肽 (1) 是瑞士制药公司诺华开发的一种肽类药物,用于治疗库欣病。
10.1 确定帕瑞肽 (1) 中立体中心的数目 (\(n\))。计算所有可能的立体异构体的总数 (\(t\))。
帕瑞肽 (1) 是一种环肽。其合成中的后期中间体(线性肽 2)可通过采用 Fmoc/tBu 策略的固相肽合成(SPPS)制备,如合成路线 1 所示。
合成路线 1. 肽 2 的 SPPS。i) 连接臂;ii) 树脂;iii) 树脂负载;iv) SPPS:重复进行 1. Fmoc 脱保护 2. 氨基酸偶联 + 最后一次 Fmoc 脱保护;v) 从树脂上切下肽并脱除 PG-2。
合成首先由 Boc-Tyr-OH (7) 制备 Fmoc-Tyr(Bn)-OH (3)。
10.2 画出上述 Fmoc-Tyr(Bn)-OH (3) 合成过程中的试剂 A 和 D 以及中间体 B 和 C。
中间体 2 的 SPPS 首先将 Fmoc-Tyr(Bn)-OH (3) 连接到合适的树脂结合连接臂上。
合成路线 2. ii) 树脂;a) 2-氯三苯甲基氯连接臂;b) 安全锁型连接臂;c) Rink 酰胺连接臂;d) SASRIN 氯化物连接臂;e) Sieber 酰胺连接臂;f) Wang 连接臂
10.3 从合成路线 2 中选择适合按合成路线 1 进行肽 2 的 SPPS 的连接臂 4。
10.4 从 g–l 中选择最适合按合成路线 1 进行 2 的 SPPS 的侧链保护基 PG-1 和 PG-2,它们应能在帕瑞肽中所有其他官能团存在的情况下正交脱除。每种保护基均只有一个正确答案。
接下来,线性肽 2 按照下列合成路线发生分子内偶联反应,形成环肽 8:
合成路线 3. vi) 碱
10.5 选择关于肽 2 环化生成 8 的正确说法。
(a) 该反应可能发生的副反应是 \(N\) 端苯丙氨酸残基的四甲基胍基化,生成下图所示的化合物 9。
(b) 该反应可能发生的副反应是保护基 PG-1 脱除,并通过赖氨酸残基的氨基环化,生成下图所示的化合物 10。
(c) 该反应必须在高肽浓度下进行,以达到足够的反应速率。
(d) 该反应必须在低肽浓度下进行,以防止缩聚。
(e) 下图中的哌啶 (11) 是适用于该反应的碱。
合成的最后几步包括对 8 中 4-羟基脯氨酸残基的 OH 基团进行官能团化,随后脱除所有保护基,得到帕瑞肽 (1)。
合成路线 4. vii) 可用作 8 的简化表示;viii) 脱除保护基
10.6 画出中间体 E(包括立体化学)和试剂 F 的结构。在 E 和 F 的结构中,按合成路线 5 所示,将中间体 8 简写为 (vii),将保护基简写为 PG-1。
10.7 确定使 8 完全转化为 13 所需的化合物 12 的最小摩尔当量。
题目译自官方英文原文。
Международная химическая олимпиада
IChO 2023
Цюрих, Швейцария · 10 теоретических задач с полными решениями
Задача 1: Молекулярная визуализация
Молекулярная визуализация — мощный инструмент медицинской диагностики. Ядерный изомер \(\ce{^{99m}Tc}\) (m = метастабильное состояние) изотопа \(\ce{^{99g}Tc}\) (g = основное состояние) обладает превосходными радиационными характеристиками (\(\gamma\)-излучатель, \(t_{1/2}=6.015\ \mathrm{h}\)) для радионуклидной визуализации. \(\ce{^{99m}Tc}\) получают в результате \(\beta^-\)-распада материнского нуклида в так называемом генераторе технеция в виде \(\ce{^{99m}Tc}\)-пертехнетата \(\ce{[^{99m}TcO4]^-}\).
1.1 Определите материнский нуклид (A) для \(\ce{^{99m}Tc}\) и испускаемую частицу (B).
1.2 Укажите степени окисления радиоактивного металла в следующих диагностических препаратах на основе \(\ce{^{99m}Tc}\).
Окислительно-восстановительные потенциалы элементов седьмой группы — марганца (\(\ce{Mn}\)), технеция (\(\ce{Tc}\)) и рения (\(\ce{Re}\)) — изменяются в соответствии с общей закономерностью периодической системы (см. рисунок 2 ниже).
Рисунок 2
1.3 Рассчитайте два недостающих окислительно-восстановительных потенциала i и ii.
1.4 Сравните \(\ce{[MnO4]^-}\), \(\ce{[TcO4]^-}\) и \(\ce{[ReO4]^-}\). Выберите наиболее сильный окислитель.
1.5 На основании значений, приведённых на рисунке 2 в условии задачи, определите, будет ли \(\ce{TcO2}\) диспропорционировать с образованием \(\ce{Tc}\) и \(\ce{TcO4^2-}\) в кислой среде.
Комплексы \(\ce{Tc}\) и \(\ce{Re}\) в степени окисления +V (\(d^2\)-системы), содержащие концевой оксо- (\(\ce{O=}\)) или нитридо-лиганд (\(\ce{N#}\)), диамагнитны. На схеме ниже представлены три возможные энергетические диаграммы молекулярных орбиталей.
1.6 Выберите энергетическую диаграмму орбиталей, которая объясняет наблюдаемый диамагнетизм. Изобразите соответствующую электронную конфигурацию на правильной диаграмме.
\(\ce{((C4H9)4N)[^{99g}TcO4]}\) — бесцветный порошок. При добавлении конц. \(\ce{HCl}\) это соединение, часто используемое в качестве исходного вещества в химии \(\ce{^{99g}Tc}\), превращается в зелёный комплекс \(\ce{((C4H9)4N)[^{99g}TcOCl4]}\).
1.7 Запишите полуреакции окисления и восстановления, используя формулы ионов или нейтральных молекул, а также полное уравнение окислительно-восстановительной реакции.
Все радиофармацевтические препараты на основе \(\ce{^{99m}Tc}\), применяемые в клинической практике, получают в «однореакторных» реакциях с использованием коммерчески доступных наборов. Обычно (\(\ce{^{99m}Tc}\) \(t_{1/2}=6.015\ \mathrm{h}\)) элюат генератора \(\ce{^{99m}Tc}\) имеет активность 12.5 ГБк (ГБк = гигабеккерель = \(10^9\) распадов в секунду).
1.8 Рассчитайте, сколько молей \(\ce{^{99m}Tc}\) содержится в таких образцах.
При стандартном исследовании пациенту вводят около 200 МБк \(\ce{^{99m}Tc}\).
1.9 Предположите, что активность не уменьшается за счёт выведения из организма. Рассчитайте, сколько часов пациент должен ждать, пока введённая активность не снизится до уровня менее 1 % от начальной активности.
Биоконъюгация радиоактивных металлов представляет собой сложную химическую задачу. Недавним примером является (3 + 2)-циклоприсоединение \(\ce{[^{99m}TcO3(tacn)]+}\) (A) (tacn = 1,4,7-триазациклононан) к алкенам. В данном случае (3 + 2) обозначает число участвующих атомов, а не число электронов. На следующей схеме показан пример этой реакции при введении метки в защищённый углевод.
1.10 Изобразите структуры соединений A и B. Также укажите степень окисления технеция в этих соединениях.
Условие переведено с официального английского текста.
Задача 2: Электрохимическое восстановление CO2
Электрохимическое восстановление \(\ce{CO2}\)
В последние годы электрохимическое превращение \(\ce{CO2}\) в продукты с более высокой добавленной стоимостью рассматривается как перспективный и технологически осуществимый подход к смягчению негативных климатических последствий, вызванных ростом его содержания в атмосфере. Для достижения этой цели разработано несколько технологий. Среди них особого внимания заслуживает электрохимическое восстановление \(\ce{CO2}\) (\(\ce{CO2}\)RR), поскольку оно позволяет использовать возобновляемую энергию для превращения экологически вредного \(\ce{CO2}\) в базовые химические продукты. Электрокатализаторы необходимы не только для ускорения по своей природе медленного процесса \(\ce{CO2}\)RR, но и для направления реакции электролиза к образованию желаемых продуктов. При этом распределение продуктов \(\ce{CO2}\)RR определяется не только химической природой самого катализатора, но и его морфологическими характеристиками на различных масштабах длины. Новая концепция разработки катализаторов \(\ce{CO2}\)RR основана на электроосаждении пеноматериалов, обладающих большой площадью поверхности, доступной для реагентов (например, \(\ce{H2O}\), \(\ce{H2}\) и \(\ce{CO2}\)). Материалы на основе меди — единственные известные металлические катализаторы \(\ce{CO2}\)RR, способные образовывать углеводороды и спирты в значительных количествах при электролизе \(\ce{CO2}\).
Ниже приведены термодинамические данные для некоторых веществ:
\(\Delta_\mathrm{f}H^\ominus\) (\(\mathrm{kJ\,mol^{-1}}\)) \(S^\ominus\) (\(\mathrm{J\,K^{-1}\,mol^{-1}}\)) \(\ce{H2O(l)}\) −285.83 69.95 \(\ce{O2(g)}\) 0 205.15 \(\ce{H2(g)}\) 0 130.68 \(\ce{CO2(g)}\) −393.52 213.79 этанол(ж) −276.00 159.86 н-пропанол(ж) −302.54 192.80 Таблица 1. Стандартная энтальпия образования \(\Delta_\mathrm{f}H^\ominus\) и стандартная энтропия \(S^\ominus\) некоторых веществ при стандартных условиях (\(T=298.15\ \mathrm{K}\), \(p^\ominus=1\ \mathrm{bar}\))
Электродная реакция \(E^\ominus\) относительно СВЭ (В) \(\ce{Cu^2+ + 2e- = Cu}\) +0.34 \(\ce{2H+ + 2e- = H2}\) 0.00 Таблица 2. Некоторые электродные полуреакции и стандартные потенциалы при стандартных условиях
2.1 Запишите и уравняйте химические уравнения электродных полуреакций для следующих процессов электрохимического восстановления в кислой среде: (i) \(\ce{CO2}\) до этанола; (ii) \(\ce{CO2}\) до н-пропанола.
2.2 Соедините полуэлемент, в котором протекает процесс восстановления, с полуэлементом \(\ce{H2}/\ce{2H+}\), который служит анодом. Рассчитайте стандартную ЭДС элемента для восстановления \(\ce{CO2}\) до этанола.
2.3 Запишите все полуреакции восстановления и окисления, протекающие соответственно на катоде и аноде.
На рисунке 1 показан принцип осаждения металла с использованием динамического шаблона из пузырьков водорода.
На рисунке 2 представлены полученные методом сканирующей электронной микроскопии изображения сверху пяти различных пен \(\ce{Cu}\), полученных при прерывании осаждения металла в разные моменты времени: 5 с, 20 с, 80 с.
Электроосаждение пены \(\ce{Cu}\) (см. рисунок 1) проводили в водном растворе серной кислоты с концентрацией 1.5 М, содержащем 0.2 М сульфата меди (\(\ce{CuSO4 * 5H2O}\)) в качестве источника меди. Диск из \(\ce{Cu}\) (\(1\ \mathrm{cm^2}\)) и фольга из \(\ce{Pt}\) служили соответственно катодом и анодом.
Рисунок 1. Схема электроосаждения пеноматериалов. При электрохимическом осаждении металла (чёрные стрелки) с высокими плотностями тока в водной среде на металлической (\(\ce{Cu}\)) подложке протекает реакция выделения водорода (HER) (1). В результате поверхность частично покрывается пузырьками \(\ce{H2}\) (2). Пузырьки \(\ce{H2}\) служат шаблоном для осаждения металла (3). В результате образуется высокопористая металлическая пена (4)
Рисунок 2. Пены \(\ce{Cu}\), полученные гальваностатическим электроосаждением \(\ce{Cu}\) при плотности тока \(j=-3\ \mathrm{A\,cm^{-2}}\). В каждом случае осаждение прерывали через определённое время: 5 с, 20 с и 80 с. Масштабная линейка одинакова на всех изображениях
2.4 Учитывая этот механизм, укажите правильное время осаждения для пен \(\ce{Cu}\), показанных на рисунке 2, в листе ответов (белые поля в левом верхнем углу).
Биметаллические системы \(\ce{CuAg}\) являются превосходными катализаторами электросинтеза спиртов из \(\ce{CO2}\). На фольгу из \(\ce{Cu}\) (\(1\ \mathrm{cm^2}\)) гальваностатически осадили 5.4 мг биметаллического пенного катализатора \(\ce{Cu}\)-\(\ce{Ag}\) (90 масс. % \(\ce{Cu}\), \(M_{\ce{Cu}}=63.546\ \mathrm{g\,mol^{-1}}\); 10 масс. % \(\ce{Ag}\), \(M_{\ce{Ag}}=107.868\ \mathrm{g\,mol^{-1}}\)) при плотности тока \(j=-3\ \mathrm{A\,cm^{-2}}\) в течение 20 с (знак минус обозначает восстановительный/катодный процесс).
2.5 Рассчитайте выход по току (FE в %) для этого процесса осаждения металла. FE определяется как \((Q_\mathrm{product}/Q_\mathrm{total})\times100\%\), где \(Q\) обозначает заряд.
Рассмотрим эксперимент по электролизу \(\ce{CO2}\), проведённый в 35 мл насыщенного \(\ce{CO2}\) раствора электролита 0.5 М \(\ce{KHCO3}\) на биметаллическом пенном катализаторе \(\ce{Cu}\)-\(\ce{Ag}\) (90 масс. % \(\ce{Cu}\); 10 масс. % \(\ce{Ag}\)). Электролиз \(\ce{CO2}\) проводили при постоянной (общей) плотности тока \(j(\mathrm{tot})=-30\ \mathrm{mA\,cm^{-2}}\) в течение 3600 с (обратите внимание, что плотность тока нормирована на геометрическую площадь поверхности \(1\ \mathrm{cm^2}\); знак минус обозначает восстановительный/катодный процесс). Анализ продуктов после электролиза показал массовые концентрации \(41.3\ \mathrm{mg\,L^{-1}}\) и \(7.4\ \mathrm{mg\,L^{-1}}\) для этанола и н-пропанола соответственно. Оба спирта являются жидкими продуктами реакции и накапливаются в электролите в ходе электролиза. Будем считать, что единственным побочным продуктом процесса является газообразный водород (\(\ce{H2}\)).
2.6 Рассчитайте плотности тока, необходимые для образования (a) этанола (\(M_\mathrm{EtOH}=46.08\ \mathrm{g\,mol^{-1}}\)) и (b) н-пропанола (\(M_\mathrm{PrOH}=60.10\ \mathrm{g\,mol^{-1}}\)), считая, что плотности тока не изменяются со временем электролиза.
2.7 Рассчитайте объём водорода, образовавшегося на площади катализатора \(1\ \mathrm{cm^2}\), при 298.15 К и 1 бар, считая образовавшийся водород идеальным газом и предполагая его полное выделение в газовую фазу. Если вы не получили результат в задании 2.6, продолжите расчёт с FE(EtOH) = 45,1 % и FE(PrOH) = 4.8 %.
Условие переведено с официального английского текста.
Задача 3: Искусственный фотосинтез
Исследования в области искусственного фотосинтеза направлены на запасание солнечной энергии в химических связях. Поглощение фотонов приводит к возбуждению сенсибилизаторов, в результате чего возникает состояние с разделёнными зарядами. Возбуждённый электрон переносится на катализатор выделения водорода (HEC), который дважды восстанавливается, а затем образует \(\ce{H2}\). В качестве фотосенсибилизатора, или поглотителя света, часто используют \(\ce{[Ru(bpy)3]^2+}\) (bpy = 2,2'-бипиридин), а в качестве HEC — комплексы кобальта.
Энергетика разложения воды
3.1 Рассчитайте энтальпию реакции \(\ce{H2 -> 2H+(aq) + 2e-}\).
Энтальпия сольватации протона: \(\Delta_{\mathrm{aq}}H(\ce{H+})=-1190\ \mathrm{kJ\,mol^{-1}}\)
Энергия ионизации водорода: \(IE_1=13.6\ \mathrm{eV}\)
Энтальпия диссоциации \(\ce{H2}\): \(\Delta_{\mathrm{diss}}H(\ce{H2})=432\ \mathrm{kJ\,mol^{-1}}\)
В идеальном случае электрохимическое разложение воды на \(\ce{O2}\) и \(\ce{H2}\) протекает при напряжении 1.23 В. Поскольку \(T\Delta S\) для этого процесса положительно, необходим подвод теплоты из окружающей среды. Если дополнительное напряжение обеспечивает выделение теплоты, необходимой для компенсации понижения температуры, процесс называют термонейтральным. Энтальпия образования \(\ce{H2O}\), \(\Delta_{\mathrm f}H^\circ(\ce{H2O})\), составляет \(-285\ \mathrm{kJ\,mol^{-1}}\).
3.2 Рассчитайте (a) энтропию реакции разложения воды \(\Delta_{\mathrm r}S^\circ\) при 25 °C для 1 моль \(\ce{H2O}\) и (b) напряжение, при котором разложение воды является термонейтральным.
Катализаторы
Комплексы типа кобальт–сален (салкомин) являются потенциальными катализаторами образования \(\ce{H2}\) из протонов и электронов. Структура салкомина приведена ниже:
Рисунок 1. Структура салкомина
3.3 Определите степень окисления атома кобальта в салкомине. Определите геометрию координационного окружения центра кобальта в салкомине, выбрав один из трёх вариантов: тетраэдрическая, плоская квадратная или октаэдрическая.
В растворе салкомин может связывать \(\ce{O2}\); молекула кислорода соединяет два фрагмента салкомина, координируясь к двум центрам Co. При этом степень окисления обоих центров Co равна +III.
3.4 Изобразите полученную структуру.
Образование \(\ce{H2}\) происходит исключительно на центре кобальта. Реакция описывается четырёхстадийным каталитическим циклом, который начинается с \(\ce{Co^2+}\) и в котором расходуются 2 \(\ce{H+}\) и 2 электрона. На одной из стадий в результате внутримолекулярного переноса электронов образуется гидрид.
3.5 Запишите два возможных варианта каталитического цикла с указанием зарядов комплекса и степеней окисления центра Co. Степень окисления центра Co не должна превышать +III. Отметьте звёздочкой стадию образования гидрида и обозначьте присоединение \(\ce{H+}\) буквой C (химическая реакция), а присоединение электрона — буквой E (электрохимическая реакция); см. пример цикла на рисунке 2 ниже. \(\ce{[Co^{II}]}\) обозначает комплекс кобальт–сален.
Рисунок 2. Пример цикла для задания 3.5
3.6 Используя значения окислительно-восстановительных потенциалов различных комплексов кобальта, приведённые в таблице 1, укажите, какой комплекс подходит для a) окисления воды при нейтральном pH и b) восстановления воды при нейтральном pH. Запишите соответствующую суммарную реакцию для обоих процессов (только для комплексов, способных осуществлять этот процесс) и рассчитайте ЭДС ячейки при нейтральном pH. Электродный потенциал восстановления протонов при pH = 7, \(T=298\ \mathrm K\) равен \(-0.41\ \mathrm V\).
Окислительно-восстановительная пара Co(III/II) \(E^\circ\) относительно нормального водородного электрода \(\ce{[Co(H2O)6]}^{3+/2+}\) \(+1.92\ \mathrm V\) \(\ce{[Co(C2O4)3]}^{3-/4-}\) \(+0.55\ \mathrm V\) \(\ce{[Co(EDTA)]}^{1-/2-}\) \(+0.38\ \mathrm V\) \(\ce{[Co(NH3)6]}^{3+/2+}\) \(+0.06\ \mathrm V\) \(\ce{[Co(en)3]}^{3+/2+}\) \(-0.18\ \mathrm V\) \(\ce{[Co(CN)5]}^{2-/3-}\) \(-0.60\ \mathrm V\) Таблица 1. Возможные окислительно-восстановительные пары для задания 3.6; \(\ce{[C2O4]^2-}\) = оксалат, en = 1,2-этилендиамин.
Краткий взгляд на природный процесс
В природе биологические эквиваленты \(\ce{H2}\) запасаются в виде NADPH, который образуется из \(\ce{NADP+}\) путём присоединения гидрид-иона. Структура NADPH показана на рисунке 3.
Рисунок 3. Структура NADPH
3.7 Изобразите структуру \(\ce{NADP+}\).
Молярный коэффициент поглощения хлорофилла при 680 нм составляет приблизительно \(\varepsilon=8\times10^4\ \mathrm{M^{-1}\,cm^{-1}}\).
3.8 Принимая эффективность превращения фотона в атом водорода равной \(\phi=20\ \%\) при плотности потока фотонов с длиной волны 680 нм, равной \(100\ \mathrm{nE\,s^{-1}\,cm^{-2}}\) (1 E = 1 моль фотонов), рассчитайте a) число фотонов в секунду и b) концентрацию хлорофилла в кювете размером \(1\times1\times1\ \mathrm{cm^3}\), необходимую для достижения скорости каталитического образования водорода \(1\ \mathrm{nmol}\ (\ce{H2})\ \mathrm{s^{-1}}\).
Условие переведено с официального английского текста.
Задача 4: Фторированные и гипервалентные соединения
Фтор образует устойчивые соединения, которые можно выделить в индивидуальном виде, практически со всеми элементами, включая благородные газы \(\ce{Kr}\) и \(\ce{Xe}\). Фторсодержащие молекулы часто имеют необычное строение. Так, фтор нередко участвует в образовании соединений с элементами групп 14–18, которые называют гипервалентными. В настоящее время синтез фторированных органических соединений в значительной степени основан на доступности специально разработанных реагентов, примером которых служит приведённое ниже соединение 4.
Подсказка: любой элемент \(E\) в ряду \(\mathbf{E^1}\)–\(\mathbf{E^8}\) может встречаться более одного раза.
Часть I. Геометрия молекул
4.1 Определите элементы \(\mathbf{E^1}\), \(\mathbf{E^2}\), \(\mathbf{E^3}\) и \(\mathbf{E^4}\) в трёх частицах 1, \(\mathbf{[2]^-}\) и \(\mathbf{[3]^-}\).
1: нейтральная молекула, не являющаяся цвиттер-ионом; окружение \(\mathbf{E^1}\) — квадратная пирамида, окружение \(\mathbf{E^2}\) — октаэдр; среднее \(d(E^1\!-\!\ce{F})=1.91\ \text{Å}\); среднее \(d(E^2\!-\!\ce{F})=1.58\ \text{Å}\)
\(\mathbf{[2]^-}\): анион, квадратная пирамида, среднее \(d(E^3\!-\!\ce{F})=1.96\ \text{Å}\)
\(\mathbf{[3]^-}\): анион, плоский пятиугольник, \(d(E^4\!-\!\ce{F})=1.98\ \text{Å}\)
Подсказки:
- Геометрия молекул относится к расположению атомов, связанных с \(E^1\)–\(E^4\)
- Согласно данным элементного анализа, массовое содержание углерода в 1 составляет 17.75 %.
Группа 15 Группа 16 Группа 17 Группа 18 \(d(\ce{P-F})=1.50\text{–}1.68\ \text{Å}\) \(d(\ce{S-F})=1.52\text{–}1.60\ \text{Å}\) \(d(\ce{Cl-F})=1.63\text{–}1.85\ \text{Å}\) \(d(\ce{As-F})=1.68\text{–}1.72\ \text{Å}\) \(d(\ce{Se-F})=1.75\text{–}1.80\ \text{Å}\) \(d(\ce{Br-F})=1.77\text{–}1.97\ \text{Å}\) \(d(\ce{Kr-F})=1.77\text{–}1.89\ \text{Å}\) \(d(\ce{Sb-F})=1.85\text{–}2.05\ \text{Å}\) \(d(\ce{Te-F})=1.80\text{–}2.00\ \text{Å}\) \(d(\ce{I-F})=1.90\text{–}2.00\ \text{Å}\) \(d(\ce{Xe-F})=1.77\text{–}2.00\ \text{Å}\) Таблица 1. Типичные диапазоны длин связей \(\ce{E-F}\) для некоторых элементов групп 15–18
4.2 Выберите элементы \(\mathbf{E^5}/\mathbf{E^6}\) и \(\mathbf{E^7}/\mathbf{E^8}\), соответственно, для которых характерна указанная геометрия, а длины связей \(\ce{E-F}\) близки к таковым в 1 (см. таблицу 1).
Часть II. Реакционная способность и строение
Рассмотрите приведённую ниже реакцию:
4.3 Выберите идеальную геометрию соединения 6 с точки зрения расположения областей электронных пар валентной оболочки вокруг атома \(\ce{Te}\):
- плоский квадрат
- квадратная пирамида
- тригональная бипирамида
- тетраэдр
- октаэдр
Укажите ожидаемые идеальные валентные углы \(C^1\!-\!\ce{Te}\!-\!\ce{I}\), \(C^2\!-\!\ce{Te}\!-\!\ce{I}\), \(\ce{I-Te-O}\) и \(C^1\!-\!\ce{Te}\!-\!C^2\).
4.4 Укажите число сигналов в спектре ЯМР \({}^{1}\mathrm{H}\), ожидаемых для двух метильных групп в соединениях 4 и 6, соответственно.
4.5 Соединение 6 последовательно реагирует с \(\ce{AgF}\) и \(\ce{(H3C)3SiCF3}\) (\(\ce{TMSCF3}\)). Установите строение \(\ce{Te}\)-содержащего промежуточного соединения A и конечного продукта B, включая их правильную геометрию, а также побочных продуктов C и D. Изобразите A и B и запишите формулы побочных продуктов C и D. Подсказка: молярная масса D равна \(92.08\ \mathrm{g\,mol^{-1}}\).
Предположим, что соединение 6 реагирует со стерически объёмной хиральной энантиомерно чистой кислотой Льюиса, например с известным производным бора 8, как показано ниже. Эта реакция должна приводить к образованию нового продукта 9, состав которого соответствует сумме составов 6 и 8. Далее предположим, что 9 представляет собой соль, в которой катион образуется из 6, а анион — из 8.
4.6 Изобразите структуры как \(\ce{Te}\)-содержащего катиона, так и борсодержащего аниона и выберите идеальную геометрию катиона с точки зрения расположения областей электронных пар валентной оболочки вокруг атома \(\ce{Te}\).
Подсказка: для 8 (хирального, энантиомерно чистого соединения) используйте следующее схематическое изображение:
Выберите идеальную молекулярную геометрию катиона:
- плоский квадрат
- плоский треугольник
- тригональная пирамида
- тригональная бипирамида
- тетраэдр
4.7 Укажите число возможных стереохимически различных солей 9.
Часть III. Синтез \(\lambda^3\)-дифторйодана и вращение вокруг одинарной связи
Соединение 10 получают из исходного вещества 8 окислением трихлоризоциануровой кислотой (TCICA, 9) в присутствии избытка \(\ce{KF}\) в сухом ацетонитриле, как показано ниже.
4.8 Запишите уравнения полуреакций и суммарное уравнение этого процесса с расставленными коэффициентами.
Подсказка: обозначьте 10 как \(\ce{R-I}\), 11 как \(\ce{R-IF2}\), а TCICA как \(\ce{C3Cl3N3O3}\). Шестичленный цикл TCICA при восстановлении сохраняется.
Группа \(\ce{IF2}\) в 12 может вращаться вокруг связи \(\ce{I-C}\) (представьте себе молекулярный пропеллер). Соответствующий барьер вращения был измерен экспериментально: \(E_\mathrm{a}=30\ \mathrm{kJ\,mol^{-1}}\). Кроме того, константа скорости вращения составляет \(k=2500\ \mathrm{s^{-1}}\) при \(228\ \mathrm{K}\).
4.9 Определите, насколько быстро в принципе может вращаться группа \(\ce{IF2}\) при комнатной температуре (\(298\ \mathrm{K}\)). Рассматривайте этот процесс как химическую реакцию, для которой требуется определить константу скорости. Запишите ответ в лист ответов. Единица измерения константы должна быть указана в \(\mathrm{s^{-1}}\).
Условие переведено с официального английского текста.
Задача 5: Гидрообессеривание
Производство топлив, не содержащих серы, — общая тенденция, направленная на снижение выбросов серосодержащих соединений, токсичных для окружающей среды. Для удаления серы на нефтеперерабатывающих заводах используют процесс гидрообессеривания с участием водорода.
5.1 Изобразите структуры продуктов A–E гидрообессеривания тиофена, зная, что A и B — циклические региоизомеры, а C — циклическое соединение.
Рисунок 1. Процесс гидрообессеривания тиофена
У серы есть два наиболее распространённых природных стабильных изотопа, \(\ce{^{32}S}\) и \(\ce{^{34}S}\), с относительными мольными долями \(x(\ce{^{32}S})=94.8\,\%\) и \(x(\ce{^{34}S})=4.37\,\%\) соответственно. У водорода природными стабильными изотопами являются \(\ce{^{1}H}\) и \(\ce{^{2}H}\) (\(\ce{D}\)) с относительными мольными долями \(x(\ce{^{1}H})=99.986\,\%\) и \(x(\ce{^{2}H})=0.014\,\%\) соответственно.
5.2 Учитывая только перечисленные выше изотопы, перечислите все изотопологи \(\ce{H2S}\).
5.3 Учитывая только перечисленные выше изотопы, перечислите все изотопологи \(\ce{H2S}\), содержащие одновременно ядра \(\ce{D}\) и \(\ce{^{34}S}\), и для каждого рассчитайте соответствующую относительную мольную долю в %.
Обессеривание — каталитический процесс, который обычно проводят на катализаторе \(\ce{MoS2}\), нанесённом на \(\ce{SiO2}\) (\(\ce{MoS2}/\ce{SiO2}\)). Для исследования поверхности катализатора можно использовать методы изотопного обмена. Реакция изотопного обмена протекает на границе раздела газ–твёрдое тело, в результате чего обмениваются исключительно поверхностные атомы. В первом приближении атомы в объёме не участвуют в обмене (рисунок 2).
В эксперименте в проточном реакторе исследовали изотопный обмен между катализатором \(\ce{MoS2}/\ce{SiO2}\) (массовая доля Mo \(w_{\mathrm{Mo}}=4.280\,\%\), первоначально содержащим только \(\ce{^{32}S}\)) и газообразным изотопно-меченым \(\ce{H2^{34}S}\) (рисунок 2). Катализатор \(\ce{MoS2}/\ce{SiO2}\) (\(m_{\mathrm{cat}}=1.2350\,\mathrm{g}\)) выдерживали в потоке (\(p=1.00\,\mathrm{bar}\), \(v=20.0\,\mathrm{mL\,min^{-1}}\), \(T=23.0\,^\circ\mathrm{C}\)) газовой смеси, содержащей \(\ce{H2^{34}S}\), остальную часть которой составлял \(\ce{Ar}\) (объёмная доля \(\varphi(\ce{H2^{34}S})=1.00\,\%\), изотопная чистота по \(\ce{^{34}S}\) \(\alpha=99.95\ \text{мол.}\,\%\)). Продолжительность эксперимента составляла \(t=10.0\,\mathrm{min}\); выходящий газ собирали в течение всего эксперимента. Измеренная доля изотопа \(\ce{^{34}S}\) среди атомов серы (\(\gamma\)) в собранной газовой фазе составила \(\gamma=87.3\ \text{мол.}\,\%\). Считайте газ идеальным и примите, что элементный (не изотопный!) состав \(\ce{MoS2}\) на поверхности и в объёме одинаков и к концу эксперимента все атомы серы на поверхности обменялись с газовой фазой.
Рисунок 2. Схематическое изображение эксперимента в ходе его проведения (A) и на заключительной стадии (B). Атомы серы на поверхности показаны красным цветом, атомы серы в объёме — синим. Атомы молибдена не показаны.
5.4 Рассчитайте количество обменявшихся атомов серы \(n(\ce{S})_{\mathrm{surface}}\) в молях.
Если вам не удалось рассчитать количество обменявшихся атомов серы, используйте во всех последующих расчётах значение \(1.53\times10^{-5}\,\mathrm{mol}\).
Предположите, что фаза \(\ce{MoS2}\) состоит из одинаковых сферических частиц и к концу эксперимента все атомы серы, расположенные на поверхности, обменялись, а атомы в объёме не участвовали в реакции обмена. Плотность \(\ce{MoS2}\) равна \(\rho=5.06\,\mathrm{g\,cm^{-3}}\), средняя площадь, занимаемая атомами \(\ce{S}\) и \(\ce{Mo}\) на поверхности, равна \(A_{\mathrm{S}}=3.00\times10^{-19}\,\mathrm{m^2}\) и \(A_{\mathrm{Mo}}=5.00\times10^{-19}\,\mathrm{m^2}\) соответственно. Площадь поверхности шара радиусом \(R\) можно рассчитать как \(S=4\pi R^2\), а его объём — как \(V=(4/3)\pi R^3\). Считайте, что изотопный состав не влияет на плотность \(\ce{MoS2}\).
5.5 Рассчитайте радиус \(R\) частиц \(\ce{MoS2}\). Приведите ответ в нм.
В действительности изотопно-меченые атомы с поверхности диффундируют в объём, а немеченые атомы из объёма перемещаются к поверхности, постепенно вступая в обмен (рисунок 3A). Поэтому в данный момент времени доля меченых атомов внутри частицы уменьшается от поверхности частицы к её центру. Одновременно с увеличением времени обмена всё больше атомов из объёма вовлекается в реакцию обмена, как схематически показано на рисунке 3B.
Рисунок 3. A) Схематическое изображение диффузии изотопов серы с поверхности в объём частицы \(\ce{MoS2}\). Атомы серы на поверхности показаны красным цветом, атомы серы в объёме — синим. Атомы молибдена не показаны. B) Доля атомов \(\ce{^{34}S}\) в объёме в зависимости от времени и расстояния от центра частицы; \(r_{\mathrm{edge}}\) соответствует радиусу частицы \(\ce{MoS2}\).
К концу эксперимента поверхностные атомы полностью обменялись, и дополнительно за счёт диффузии обменялась часть атомов в объёме. Долю обменявшихся атомов в объёме, \(n(\ce{S})_{\mathrm{bulk}}^{\mathrm{ex}}\), от общего количества атомов серы в объёме, \(n(\ce{S})_{\mathrm{bulk}}^{\mathrm{total}}\), можно рассчитать следующим образом:
\[ F=n(\ce{S})_{\mathrm{bulk}}^{\mathrm{ex}}/ n(\ce{S})_{\mathrm{bulk}}^{\mathrm{total}} =1-\exp(-Dt/R^2) \]
Здесь \(t\) — время эксперимента по обмену (описанного выше), \(R\) — радиус частицы, а \(D\) — коэффициент диффузии. Описанный выше катализатор независимо исследовали методом электронной микроскопии, который показал, что частицы \(\ce{MoS2}\) представляют собой равномерно распределённые сферы радиусом \(35.0\,\mathrm{nm}\).
5.6 Используя \(R=35.0\,\mathrm{nm}\) и данные описанного выше эксперимента по обмену, рассчитайте коэффициент диффузии \(D\) (в \(\mathrm{m^2\,s^{-1}}\)) атомов серы в \(\ce{MoS2}\). В расчётах используйте приближение \(e^x\approx1+x\) при \(x\ll1\).
Условие переведено с официального английского текста.
Задача 6: Прямое превращение метана в метанол
Метан широко доступен в виде природного газа, что делает его привлекательным сырьём для химической промышленности, например для производства метанола. Однако управлять этим процессом непросто, поскольку метанол окисляется легче, чем метан. Избыточного окисления удаётся избежать в процессе химического циклирования, в котором активные центры цеолитных катализаторов, содержащих ионообменно введённую медь, предоставляют только один атом кислорода, необходимый для окисления до метанола, и при этом расходуются. На второй стадии катализатор регенерируют кислородом в отсутствие метана. На приведённой ниже схеме показаны два возможных каталитических центра меди. В ходе реакции Cu(II) восстанавливается до Cu(I).
6.1 Укажите число центров S1 и число центров S2, необходимых для окисления одной молекулы метана до метанола.
В отсутствие кислорода образующийся метанол не десорбируется с цеолита. Если реакцию проводят в сосуде при постоянных объёме и температуре (автоклаве), снижение давления обусловлено только расходованием метана, который можно считать идеальным газом. В автоклаве объёмом 1 л, содержащем 200 мг цеолита с массовой долей меди 4.3 %, начальное давление метана \(p_0 = 933\ \mathrm{Pa}\) после завершения реакции при 528 К снизилось до \(p_\infty = 925\ \mathrm{Pa}\).
6.2 Рассчитайте, какой процент меди прореагировал.
6.3 Экспериментальные данные представлены на рисунке 1. На их основе определите (псевдо)порядок реакции окисления \(\ce{CH4}\).
(a) Реакция имеет (псевдо)нулевой порядок.
(b) Реакция имеет (псевдо)первый порядок.
(c) Реакция имеет (псевдо)второй порядок.
Рисунок 1. Полулогарифмический график зависимости нормированного давления метана от времени для реакции с содержащим медь цеолитом с центрами S1 и S2 в автоклаве при различных температурах. Символами обозначены экспериментальные точки. Сплошные линии представляют собой линейные аппроксимации на соответствующих интервалах времени. Пунктирные линии служат визуальными ориентирами
6.4 Запишите (псевдо)кинетическое уравнение окисления \(\ce{CH4}\), согласующееся с экспериментальными данными в указанных условиях. Учтите, что оно может зависеть от концентраций как \(\ce{CH4}\), так и центров S1 и S2, а также от констант скорости.
6.5 Выберите верное утверждение (верные утверждения).
(a) В реакцию вступают по меньшей мере два типа центров меди, каждому из которых соответствует своя константа скорости.
(b) Суммарное окисление метана цеолитом протекает быстрее при более высокой температуре.
(c) При более высокой температуре к моменту завершения реакции с метаном прореагирует бо́льшая доля центров меди.
(d) Одна из реакций замедляется при повышении температуры.
Парамагнитные центры S1 можно наблюдать методом спектроскопии электронного парамагнитного резонанса (ЭПР), тогда как диамагнитные центры S2 не дают сигнала ЭПР. Спектроскопия ЭПР позволяет измерять число электронных спинов. Поэтому число центров S1 пропорционально двойному интегралу \(I_2\) спектра ЭПР, т. е. \([\mathbf{S1}] \propto I_2\). Спектры измеряли при различных температурах \(T\), а при каждой температуре — в различные моменты времени \(t\) после начала реакции.
6.6 Выведите линейное по времени уравнение, связывающее \(I_2(t)\) с константой скорости исчезновения центров S1.
6.7 Отметьте в листе ответов клетки для каждого измерения, требующего калибровки по известному стандартному образцу Cu(II).
(a) Общее число парамагнитных центров Cu(II) в образце.
(b) Концентрация парамагнитных центров Cu(II) в образце.
(c) Константа скорости.
(d) Типы различных парамагнитных форм Cu(II) в образце.
Из измерений ЭПР известно, что константа скорости реакции с центрами S1 при 528 К равна \(2.604 \times 10^{-3}\ \mathrm{s^{-1}}\).
6.8 Рассмотрев рисунок 1 и выполнив расчёт, определите, реагирует ли метан с центрами S2 быстрее или медленнее, чем с центрами S1.
(a) Метан быстрее реагирует с S1.
(b) Скорости обеих реакций одинаковы.
(c) Метан быстрее реагирует с S2.
Метанол можно далее превращать в ценные олефины с помощью других цеолитных катализаторов. В этом процессе наблюдается промежуточный продукт с молярной массой \(86.09\ \mathrm{g\,mol^{-1}}\), результатами элементного анализа (массовые доли: 55.8 % \(\ce{C}\), 7.0 % \(\ce{H}\)) и спектром ЯМР \({}^{1}\mathrm{H}\), состоящим из сигналов при четырёх различных химических сдвигах:
a: 12.2 м. д. (1H, с), широкий, исчезает при добавлении \(\ce{D2O}\)
b: 6.3 м. д. (1H, д)
c: 5.7 м. д. (1H, д)
d: 2.0 м. д. (3H, с)
6.9 Изобразите структуру промежуточного продукта и укажите отнесение протонов a и d.
Министерство энергетики США выделило двенадцать химических соединений, содержащих только \(\ce{C}\), \(\ce{H}\) и \(\ce{O}\), в качестве платформенных химических соединений. Это наиболее перспективные кандидаты, которые легко получать из возобновляемых ресурсов и из которых можно синтезировать множество целевых производных. Одно из них — соединение A, которое можно либо превращать в другие производные, либо использовать, например, в медицине или в моющих средствах.
- ЯМР \({}^{1}\mathrm{H}\) в ДМСО: 7.81 м. д. (a, с), 13.0 м. д. (b, с, широкий, исчезает при добавлении \(\ce{D2O}\)); оба сигнала имеют одинаковую интегральную интенсивность.
- ЯМР \({}^{13}\mathrm{C}\): 165.1 м. д. (1), 150.6 м. д. (2) и 120.6 м. д. (3).
- \(M = 156.03\ \mathrm{g\,mol^{-1}}\). Элементный анализ: массовые доли 46.15 % \(\ce{C}\), 2.56 % \(\ce{H}\).
6.10 Приведите возможную структуру A и укажите отнесение всех протонов и атома углерода 1.
Условие переведено с официального английского текста.
Задача 7: Ферментативная кинетика
Механизм Михаэлиса–Ментен (ММ), предложенный в 1913 году, описывает кинетику ферментативного катализа. В этом механизме фермент \(\ce{E}\) катализирует превращение субстрата \(\ce{S}\) в продукт \(\ce{P}\):
Начальная скорость ферментативной реакции, протекающей по механизму ММ, задаётся выражением
\[ v_0=v_{\max}\frac{[\ce{S}]_0}{K_{\mathrm M}+[\ce{S}]_0} \tag{1} \]
при условии, что начальная концентрация \(\ce{E}\) намного ниже начальной концентрации \(\ce{S}\), \([\ce{E}]_0\ll[\ce{S}]_0\). Константа Михаэлиса определяется как \(K_{\mathrm M}=(k_2+k_3)/k_1\). Начальную скорость можно также выразить как произведение относительного потока \(j\) и \([\ce{E}]_0\):
\[ v_0=j[\ce{E}]_0 \tag{2} \]
Примечание: в вопросах 7.1 и 7.2 может быть один или несколько правильных ответов либо ни одного.
7.1 Выберите правильные альтернативные формы выражений (1) и (2) для начальной скорости (\(v_0\)).
\([\ce{ES}]_{\max}\) — максимальная концентрация комплекса \(\ce{ES}\).
- (a) \(\displaystyle v_0=\frac{k_3[\ce{E}]_0[\ce{S}]_0}{K_{\mathrm M}+[\ce{S}]_0}\)
- (b) \(\displaystyle v_0=\frac{k_3[\ce{E}]}{K_{\mathrm M}/[\ce{S}]_0+1}\)
- (c) \(\displaystyle v_0=j[\ce{ES}]_{\max}\)
- (d) \(\displaystyle v_0=\frac{k_3[\ce{E}]_0[\ce{ES}]_{\max}}{K_{\mathrm M}+[\ce{S}]_0}\)
- (e) \(\displaystyle v_0=\frac{k_3[\ce{E}]_0}{K_{\mathrm M}/[\ce{S}]_0+1}\)
- (f) \(\displaystyle v_0=\frac{j[\ce{E}]_0}{K_{\mathrm M}+[\ce{S}]_0}\)
7.2 Выберите пары величин, откладываемых по осям (\(y\) в зависимости от \(x\)), для которых ожидается линейный график.
- (a) \(v_0\) в зависимости от \(1/[\ce{S}]_0\)
- (b) \(v_0\) в зависимости от \(v_0/K_{\mathrm M}\)
- (c) \(v_0\) в зависимости от \(K_{\mathrm M}/v_0\)
- (d) \(1/v_0\) в зависимости от \(v_0/[\ce{S}]_0\)
- (e) \(1/v_0\) в зависимости от \(v_0/K_{\mathrm M}\)
- (f) \([\ce{S}]_0/v_0\) в зависимости от \([\ce{S}]_0\)
Многие ферменты катализируют превращения с участием нескольких субстратов, а не одного. Однако если концентрация одного из субстратов намного выше концентрации другого или поддерживается постоянной, кинетика ММ также применима. Здесь мы рассмотрим две независимые ферментативные системы, подчиняющиеся кинетике ММ.
Ферментативная система I
Фермент \(\ce{E}\) превращает субстраты \(\ce{A}\) и \(\ce{B}\) в продукты \(\ce{P_A}\) и \(\ce{P_B}\). При быстро устанавливающемся предварительном равновесии между свободным ферментом и всеми фермент-субстратными комплексами справедливо следующее уравнение:
\[ v_0= \frac{k[\ce{E}]_0[\ce{A}]_0[\ce{B}]_0} {(K+[\ce{A}]_0)(K+[\ce{B}]_0)} \tag{3} \]
где \(k\) — константа скорости одной из реакций. Одна и та же константа равновесия \(K\) характеризует диссоциацию каждого из субстратов из соответствующего активного центра \(\ce{E}\).
7.3 Покажите, что уравнение (3) принимает форму уравнения ММ (1), если концентрация субстрата \(\ce{B}\) поддерживается на постоянном уровне \(c_0\). Приведите выражение для \(v_{\max}\) в этом случае.
7.4 Предложите кинетическую схему для ферментативной системы I, согласующуюся с уравнением (3), указав все промежуточные соединения и продукты. Укажите реакцию с константой скорости \(k\).
Ферментативная система II
Фермент \(\ce{E}\) имеет пять активных центров, каждый из которых специфичен к одному из субстратов \(\ce{S_A}\), \(\ce{S_B}\) или \(\ce{S_C}\), селективно превращающихся в продукты \(\ce{P_A}\), \(\ce{P_B}\) или \(\ce{P_C}\) соответственно. Для каждого субстрата имеется по крайней мере один активный центр. Каждый активный центр независим от остальных.
Для \(\ce{E}\) известно следующее:
-
Сродство к \(\ce{S_C}\) выше, чем к \(\ce{S_B}\).
-
График зависимости \(v_{0i}\) от \(v_{0i}/[\ce{S_i}]_0\), известный как график Иди–Хофсти, для \(\ce{S_A}\), \(\ce{S_B}\), \(\ce{S_C}\), со скоростью, приведённой в расчёте на один активный центр (\(v_{0i}\)), показан ниже, однако масштаб и легенда не указаны.
-
При насыщении \(\ce{E}\) субстратами \(\ce{S_A}\), \(\ce{S_B}\), \(\ce{S_C}\) число оборотов катализатора (TON) для \(\ce{S_C}\) в расчёте на один центр составляет \(10200\ \mathrm{min^{-1}}\), а за секунду синтезируется в общей сложности 2023 молекулы продуктов \(\ce{P_A}\), \(\ce{P_B}\), \(\ce{P_C}\). При этом за час регистрируется образование не более \(5.94\times10^6\) молекул \(\ce{P_A}\) и \(\ce{P_B}\).
-
При равных молярных концентрациях \(\ce{S_A}\), \(\ce{S_B}\), \(\ce{S_C}\), которые по крайней мере в 1000 раз ниже соответствующих значений \(K_{\mathrm M,i}\), концентрации \(\ce{P_A}\), \(\ce{P_B}\), \(\ce{P_C}\) становятся пропорциональными каталитической эффективности \((\varepsilon_i=k_{i3}/K_{\mathrm M,i})\), а их соотношение составляет \(3:2:5\) соответственно.
-
Два комплекса \(\ce{ES_i}\) имеют одинаковые константы скорости диссоциации на \(\ce{E}\) и \(\ce{S_i}\). Активационный барьер реакции превращения \(\ce{ES_C}\) в исходные соединения на \(1266\ \mathrm{J\,mol^{-1}}\) выше, чем для реакции превращения в конечные продукты. Считайте, что предэкспоненциальные множители для обеих реакций одинаковы и \(T=25\,^\circ\mathrm C\).
-
Для реакции \(\ce{E + S_i}\): \(k_{\mathrm{c1}}=1.57\times10^7\ \mathrm{M^{-1}\,s^{-1}}\) и \(k_{\mathrm{a1}}=k_{\mathrm{b1}}\).
7.5 Заполните приведённую ниже таблицу и представьте свои расчёты. Подсказки:
- Используйте информацию из пунктов 1 и 2, чтобы определить соотношение (\(<\), \(>\), \(=\)) между константами \(K_{\mathrm M,A}\), \(K_{\mathrm M,B}\) и \(K_{\mathrm M,C}\).
- Информация из пунктов 3 и 5 позволяет заполнить первый столбец (число активных центров для каждого субстрата) и последнюю строку (все константы для субстрата \(\ce{S_C}\)) таблицы. Проверьте, что суммарное число активных центров равно 5.
Число активных центров \(k_1\) \(k_2\) \(k_3\) \(K_{\mathrm M}\) \(\ce{S_A}\) \(\ce{S_B}\) \(\ce{S_C}\) \(1.57\times10^7\ \mathrm{M^{-1}\,s^{-1}}\) Условие переведено с официального английского текста.
Задача 8: Реакция Назарова
Реакция Назарова — часто используемая реакция дивинилкетонов с образованием циклопентенонов. Она протекает либо фотохимически, либо при кислотном катализе и представляет собой электроциклизацию с последующим переносом протона.
8.1 Изобразите π-молекулярные орбитали для описания реакции Назарова. Распределите электроны по соответствующим энергетическим уровням. Отметьте знаком x (i) HOMO (высшую занятую молекулярную орбиталь) и (ii) LUMO (низшую свободную молекулярную орбиталь). В этом задании дивинилкетон можно рассматривать как пентадиенильный катион с пятью p-орбиталями.
8.2 На основании π-молекулярных орбиталей, полученных в задании 8.1, предскажите, при каких условиях реакция Назарова для дивинилкетона будет протекать дисротаторно или конротаторно. Отметьте в таблице знаком x условия, при которых реакция разрешена.
Дисротаторно Конротаторно Термически Фотохимически 8.3 Реакция Назарова использовалась в качестве ключевой реакции в синтезе фарнезина. Для обоих приведённых ниже условий изобразите по одной возможной структуре A и B, указав стереохимию. Обратите внимание, что в спектрах ЯМР \(\ce{^1H}\) продуктов обеих реакций наблюдается сигнал при 6.70–6.73 м. д.
Синтез капнеллена начинается с ненасыщенного альдегида C, показанного ниже. Обработка реагентом D с последующей реакцией с \(\ce{MnO2}\), нанесённым на углеродный носитель, дала дивинилкетон E, показанный ниже. Воздействие смеси \(\ce{P2O5}\) и MsOH привело к образованию F, который посредством последовательности реакций был превращён в ненасыщенный кетон I.
8.4 Выберите из списка реагент(ы), подходящий(ие) в качестве D.
(a) \(\ce{H2C=CHMgBr}\) (c) \(\ce{H2C=CHBr}\), \(\ce{Pd(PPh3)4}\)
(b) 1. \(\ce{NaBH4}\) 2. \(\ce{H2C=CHLi}\) (d) \(\ce{H2C=CHMgBr}\), \(\ce{CuI}\)
8.5 Приведите структуры промежуточных соединений F, G и H, указав их стереохимию.
Затем енон I обработали \(\ce{H2C=CHMgBr}\) и \(\ce{CuI}\) в ТГФ с получением промежуточного соединения J, последующий озонолиз которого дал промежуточное соединение K, в спектре ЯМР \(\ce{^1H}\) которого наблюдается сигнал при 9.61 м. д. Обработка 5%-ным \(\ce{KOH}\) в смеси ТГФ и эфира дала промежуточное соединение L. Гидрирование на Pt-катализаторе в атмосфере \(\ce{H2}\) привело к получению M, из которого в конечном итоге был получен капнеллен.
8.6 Приведите структуры J, K, L и M, указав их стереохимию.
Условие переведено с официального английского текста.
Задача 9: Электролиз в органическом синтезе
Электролиз Кольбе представляет собой декарбоксилирующую димеризацию двух карбоновых кислот и протекает только при условии депротонирования кислоты. Ниже приведена схема реакции без расставленных коэффициентов.
В ходе реакции образуются два газа (B и C). B реагирует с \(\ce{Ca(OH)2}\), а C легко воспламеняется.
9.1 Приведите структурные формулы A, B и C.
9.2 Формально этот синтез представляет собой окислительно-восстановительную реакцию, в которой карбоксилат окисляется, а растворитель восстанавливается. Запишите полуреакции окисления и восстановления и суммарную окислительно-восстановительную реакцию.
9.3 Приведите промежуточные частицы 1 и 2 в механизме окислительного декарбоксилирования и образования продукта.
Электролиз Кольбе обычно эффективен только для насыщенных карбоновых кислот с длинной цепью и неэффективен для некоторых карбоновых кислот, таких как D. В этом случае облегчается дальнейшее окисление радикального интермедиата E до положительно заряженной частицы F. Интермедиат F может реагировать с нуклеофилами с образованием различных побочных продуктов: например, с D он образует сложный эфир G, а с \(\ce{MeOH}\) — H.
9.4 Приведите структуры D–H.
При электролизе карбоновой кислоты I в присутствии избытка второй кислоты J образуются два основных продукта (по данным анализа методом ЯМР \({}^{1}\mathrm{H}\)), которые невозможно разделить хроматографией на силикагеле. Их спектроскопические данные практически идентичны. В спектре ЯМР \({}^{1}\mathrm{H}\) эти два соединения различаются лишь по двум сигналам с небольшими различиями химических сдвигов.
Спектр ЯМР \({}^{1}\mathrm{H}\) имеет следующий вид (смесь продуктов K и L в соотношении 1:1):
4.18–4.08 (м, 4 H), 3.95–3.60 (м, 6 H), 3.43 (дт, 2 H, \(J=7.8,\ 2.2\ \mathrm{Hz}\)),
2.55–2.25 (м, 4 H), 2.20–1.95 (м, 2 H), 1.65–1.50 (м, 2 H)Характерные сигналы K:
1.26 (т, 3 H, \(J=7.2\ \mathrm{Hz}\)), 1.20 (д, 3 H, \(J=6.6\ \mathrm{Hz}\))
Характерные сигналы L:
1.24 (т, 3 H, \(J=7.2\ \mathrm{Hz}\)), 1.15 (д, 3 H, \(J=6.6\ \mathrm{Hz}\))
9.5 Приведите структуры продуктов K и L. Укажите, какое отношение существует между этими продуктами.
(a) Эпимеры (b) Энантиомеры
(c) Диастереомеры (d) Структурные изомеры
Выбор материала электрода может влиять на селективность реакции органического электросинтеза. Восстановительный электролиз бензальдегида (M) (16 мМ в 1 М водном растворе \(\ce{KOH}\), анод из \(\ce{Pt}\), −1.3 В относительно \(\ce{Ag/AgCl}\)) приводит к различным продуктам в зависимости от используемого материала катода. Прочное связывание с поверхностью способствует межмолекулярным реакциям. На рисунке ниже показаны распределение продуктов для различных материалов катода и масс-спектры продуктов.
9.6 Приведите структуры N и O.
Алкены, такие как енольные эфиры, могут вступать в окислительное сочетание. Обычно оно включает анодное окисление алкенового фрагмента с образованием катион-радикала, который может быть перехвачен нуклеофилом.
9.7 Приведите структурные формулы P, Q, R и S на схеме ниже. Указывать стереохимию не требуется. Подсказка: S — трициклический продукт.
Условие переведено с официального английского текста.
Задача 10: Швейцария — страна фармацевтики
Пасиреотид (1) — лекарственный препарат пептидной природы, разработанный швейцарской фармацевтической компанией Novartis для лечения болезни Кушинга.
10.1 Определите число стереогенных центров (\(n\)) в пасиреотиде (1). Рассчитайте общее число всех возможных стереоизомеров (\(t\)).
Пасиреотид (1) — циклический пептид. Промежуточное соединение, получаемое на поздней стадии его синтеза (линейный пептид 2), можно получить методом твердофазного пептидного синтеза (SPPS) с использованием стратегии Fmoc/tBu, как показано на схеме 1.
Схема 1. SPPS пептида 2. i) Линкер; ii) Смола; iii) Загрузка смолы; iv) SPPS: повторение стадий 1. Снятие защиты Fmoc 2. Присоединение аминокислоты + заключительное снятие защиты Fmoc; v) Отщепление пептида от смолы и снятие защиты PG-2.
Синтез начинается с получения Fmoc-Tyr(Bn)-OH (3) из Boc-Tyr-OH (7).
10.2 Изобразите реагенты A и D и промежуточные соединения B и C в приведённом выше синтезе Fmoc-Tyr(Bn)-OH (3).
SPPS промежуточного соединения 2 начинается с присоединения Fmoc-Tyr(Bn)-OH (3) к подходящему линкеру, связанному со смолой.
Схема 2. ii) Смола; a) 2-Хлортритилхлоридный линкер; b) Линкер типа «предохранитель» (safety-catch); c) Амидный линкер Ринка; d) SASRIN-хлоридный линкер; e) Амидный линкер Зибера; f) Линкер Ванга
10.3 Выберите на схеме 2 линкер(ы) 4, подходящие для SPPS пептида 2 согласно схеме 1.
10.4 Из вариантов g–l выберите наиболее подходящие защитные группы боковых цепей PG-1 и PG-2 для SPPS соединения 2 согласно схеме 1, которые можно ортогонально удалить в присутствии всех остальных функциональных групп пасиреотида. Для каждой защитной группы верен только один ответ.
Далее линейный пептид 2 вступает во внутримолекулярную реакцию сочетания с образованием циклического пептида 8 согласно следующей схеме:
Схема 3. vi) Основание
10.5 Выберите верное(ые) утверждение(я) о циклизации пептида 2 в 8.
(a) Возможной побочной реакцией является тетраметилгуанидинирование \(N\)-концевого остатка фенилаланина с образованием изображённого ниже соединения 9.
(b) Возможной побочной реакцией является отщепление защитной группы PG-1 и циклизация с участием аминогруппы остатка лизина с образованием изображённого ниже соединения 10.
(c) Реакцию необходимо проводить при высокой концентрации пептида для достижения достаточной скорости реакции.
(d) Реакцию необходимо проводить при низкой концентрации пептида для предотвращения поликонденсации.
(e) Изображённый ниже пиперидин (11) является подходящим основанием для этой реакции.
Последние стадии синтеза включают функционализацию OH-группы остатка 4-гидроксипролина в соединении 8 с последующим удалением всех защитных групп (PG) и получением пасиреотида (1).
Схема 4. vii) Можно использовать как упрощённое изображение 8; viii) Отщепление защитных групп
10.6 Изобразите структуры промежуточного соединения E (с указанием стереохимии) и реагента F. В структурах E и F используйте сокращённое обозначение (vii) для промежуточного соединения 8 и PG-1 для защитной группы, как показано на схеме 5.
10.7 Определите минимальное число мольных эквивалентов соединения 12, необходимое для полного превращения 8 в 13.
Условие переведено с официального английского текста.
الأولمبياد الدولي للكيمياء
IChO 2023
زيورخ، سويسرا · 10 مسائل نظرية مع حلول كاملة
المسألة 1: التصوير الجزيئي
التصوير الجزيئي أداة فعّالة في التشخيص الطبي. يتمتع المتماكب النووي \(\ce{^{99m}Tc}\) (m = شبه مستقر) للنظير \(\ce{^{99g}Tc}\) (g = الحالة القاعية) بخصائص إشعاعية ممتازة (باعث لأشعة \(\gamma\)، \(t_{1/2}=6.015\ \mathrm{h}\)) للتصوير الإشعاعي. يُحصَل على \(\ce{^{99m}Tc}\) عن طريق اضمحلال \(\beta^-\) لنويدة أم في ما يُسمّى مولّد التكنيشيوم، على هيئة بيرتكنيتات \(\ce{^{99m}Tc}\)، أي \(\ce{[^{99m}TcO4]^-}\).
1.1 حدّد النويدة الأم (A) لـ \(\ce{^{99m}Tc}\) والجسيم المنبعث (B).
1.2 اذكر حالات تأكسد الفلز المشع في مجسّات \(\ce{^{99m}Tc}\) الآتية.
تتبع جهود الأكسدة والاختزال لعناصر المجموعة السابعة، المنغنيز (\(\ce{Mn}\)) والتكنيشيوم (\(\ce{Tc}\)) والرينيوم (\(\ce{Re}\))، الاتجاه العام في الجداول الدورية (انظر الشكل 2 أدناه).
الشكل 2
1.3 احسب جهدَي الأكسدة والاختزال المفقودين i وii.
1.4 قارن بين \(\ce{[MnO4]^-}\) و\(\ce{[TcO4]^-}\) و\(\ce{[ReO4]^-}\). اختر أقوى عامل مؤكسد.
1.5 استنادًا إلى القيم المبيّنة في الشكل 2 في ورقة الأسئلة، حدّد ما إذا كان \(\ce{TcO2}\) سيخضع لتفاعل عدم تناسب إلى \(\ce{Tc}\) و\(\ce{TcO4^2-}\) في وسط حمضي.
معقّدات \(\ce{Tc}\) و\(\ce{Re}\) في حالة التأكسد +V (أنظمة \(d^2\))، التي تحتوي على ربيطة أوكسو طرفية (\(\ce{O=}\)) أو ربيطة نتريدو طرفية (\(\ce{N#}\))، هي معقّدات دايامغناطيسية. يوضّح المخطط أدناه ثلاثة مخططات ممكنة لطاقات المدارات الجزيئية.
1.6 اختر مخطط طاقات المدارات الذي يفسّر الدايامغناطيسية الملحوظة. ارسم التوزيع الإلكتروني الموافق في المخطط الصحيح.
المركّب \(\ce{((C4H9)4N)[^{99g}TcO4]}\) مسحوق عديم اللون. وبإضافة \(\ce{HCl}\) المركّز، يتحوّل هذا المركّب الابتدائي الشائع في كيمياء \(\ce{^{99g}Tc}\) إلى المعقّد الأخضر \(\ce{((C4H9)4N)[^{99g}TcOCl4]}\).
1.7 اكتب نصفَي تفاعل الأكسدة والاختزال باستخدام صيغ الأيونات أو الجزيئات المتعادلة، وكذلك تفاعل الأكسدة والاختزال الكامل.
تُحضَّر جميع مقتفيات \(\ce{^{99m}Tc}\) الإشعاعية المستخدمة سريريًا في تفاعلات «وعاء واحد»، باستخدام أطقم متاحة تجاريًا. عادةً (\(\ce{^{99m}Tc}\) \(t_{1/2}=6.015\ \mathrm{h}\))، يكون نشاط سائل الإزاحة من مولّد \(\ce{^{99m}Tc}\) مقداره 12.5 GBq (GBq = غيغابكريل = \(10^9\) اضمحلالات في الثانية).
1.8 احسب عدد مولات \(\ce{^{99m}Tc}\) الموجودة في مثل هذه العينات.
للتصوير المعتاد، يُعطى المريض نحو 200 MBq من \(\ce{^{99m}Tc}\).
1.9 افترض عدم فقدان أي نشاط عن طريق الإطراح. احسب عدد الساعات التي يجب على المريض انتظارها حتى ينخفض النشاط المحقون إلى أقل من 1 % من النشاط الابتدائي.
يمثّل الاقتران الحيوي للفلزات المشعة تحدّيًا كيميائيًا. ومن الأمثلة الحديثة عليه الإضافة الحلقية (3 + 2) للمعقّد \(\ce{[^{99m}TcO3(tacn)]+}\) (A) (tacn = 1,4,7-تري آزاسيكلونونان) مع الألكينات. وفي هذا السياق، تشير (3 + 2) إلى عدد الذرات المشاركة، وليس إلى عدد الإلكترونات. يوضّح المخطط الآتي مثالًا على هذا التفاعل بوسم كربوهيدرات محمية.
1.10 ارسم بنيتَي المركّبين A وB. واذكر أيضًا حالة تأكسد التكنيشيوم في هذين المركّبين.
نص المسألة مترجم عن النص الإنجليزي الرسمي.
المسألة 2: الاختزال الكهروكيميائي لثاني أكسيد الكربون
الاختزال الكهروكيميائي لـ \(\ce{CO2}\)
في السنوات الأخيرة، عُدّ التحويل الكهروكيميائي لـ \(\ce{CO2}\) إلى منتجات أعلى قيمةً نهجًا واعدًا وقابلًا للتطبيق تقنيًا للتخفيف من الآثار المناخية السلبية الناجمة عن تزايد مستوياته في الغلاف الجوي. وقد طُوّرت عدة تقنيات لتحقيق هذا الهدف. ومن بينها، يستحق اختزال \(\ce{CO2}\) بالوسائل الكهروكيميائية (\(\ce{CO2}\)RR) اهتمامًا خاصًا لإمكانية تشغيله بالطاقة المتجددة لتحويل \(\ce{CO2}\) الضار بالبيئة إلى مواد كيميائية أساسية تُستخدم في تصنيع منتجات أخرى. وتُعدّ المحفزات الكهروكيميائية ضرورية ليس فقط لتسريع تفاعل \(\ce{CO2}\)RR البطيء بطبيعته، بل أيضًا لتوجيه تفاعل التحليل الكهربائي نحو نواتج التفاعل المرغوبة. وفي هذا السياق، لا تقتصر العوامل التي تتحكم في توزيع نواتج \(\ce{CO2}\)RR على الطبيعة الكيميائية للمحفز نفسه، بل تشمل أيضًا خصائصه المورفولوجية على مقاييس طولية مختلفة. ويعتمد مفهوم جديد لتصميم محفزات \(\ce{CO2}\)RR على الترسيب الكهربائي لمواد ذات بنية رغوية، توفر مساحة سطحية كبيرة يمكن للمتفاعلات الوصول إليها (مثل \(\ce{H2O}\) و\(\ce{H2}\) و\(\ce{CO2}\)). وتُعدّ المواد القائمة على النحاس المحفزات الفلزية الوحيدة المعروفة لتفاعل \(\ce{CO2}\)RR التي تستطيع إنتاج الهيدروكربونات والكحولات بكميات كبيرة عن طريق التحليل الكهربائي لـ \(\ce{CO2}\).
فيما يلي بيانات ديناميكية حرارية لمواد مختارة:
\(\Delta_\mathrm{f}H^\ominus\) (\(\mathrm{kJ\,mol^{-1}}\)) \(S^\ominus\) (\(\mathrm{J\,K^{-1}\,mol^{-1}}\)) \(\ce{H2O(l)}\) −285.83 69.95 \(\ce{O2(g)}\) 0 205.15 \(\ce{H2(g)}\) 0 130.68 \(\ce{CO2(g)}\) −393.52 213.79 إيثانول(l) −276.00 159.86 n-بروبانول(l) −302.54 192.80 الجدول 1. إنثالبي التكوين القياسي \(\Delta_\mathrm{f}H^\ominus\) والإنتروبيا القياسية \(S^\ominus\) لبعض المواد في الظروف القياسية (\(T=298.15\ \mathrm{K}\)، \(p^\ominus=1\ \mathrm{bar}\))
تفاعل الخلية \(E^\ominus\) بالنسبة إلى قطب الهيدروجين القياسي SHE (V) \(\ce{Cu^2+ + 2e- = Cu}\) +0.34 \(\ce{2H+ + 2e- = H2}\) 0.00 الجدول 2. تفاعلات مختارة لأنصاف الخلايا وجهودها القياسية في الظروف القياسية
2.1 اكتب ووازن المعادلات الكيميائية لتفاعلات أنصاف الخلايا لعمليتي الاختزال الكهروكيميائي التاليتين في وسط حمضي: (i) تحويل \(\ce{CO2}\) إلى إيثانول؛ (ii) تحويل \(\ce{CO2}\) إلى n-بروبانول.
2.2 اقرن نصف خلية عملية الاختزال بنصف خلية \(\ce{H2}/\ce{2H+}\)، بحيث يعمل الأخير بوصفه المصعد. احسب قيمة جهد الخلية القياسي لاختزال \(\ce{CO2}\) إلى إيثانول.
2.3 اكتب جميع تفاعلات أنصاف الخلايا للاختزال والأكسدة التي تحدث عند المهبط والمصعد، على الترتيب.
يوضح الشكل 1 مبدأ ترسيب الفلز باستخدام فقاعات الهيدروجين الديناميكية قوالبَ للترسيب.
يعرض الشكل 2 صورًا بالمجهر الإلكتروني الماسح، مأخوذة من أعلى، لخمس رغوات مختلفة من \(\ce{Cu}\) جرى الحصول عليها بإيقاف ترسيب الفلز عند أزمنة مختلفة: 5 s و20 s و80 s.
أُجريت عمليات الترسيب الكهربائي لرغوة \(\ce{Cu}\) (انظر الشكل 1) في محلول مائي من حمض الكبريتيك بتركيز 1.5 M يحتوي على كبريتات النحاس (\(\ce{CuSO4 * 5H2O}\)) بتركيز 0.2 M بوصفها مصدرًا للنحاس. واستُخدم قرص من \(\ce{Cu}\) (\(1\ \mathrm{cm^2}\)) ورقيقة من \(\ce{Pt}\) بوصفهما المهبط والمصعد، على الترتيب.
الشكل 1. تمثيل للترسيب الكهربائي لمواد ذات بنية رغوية. أثناء الترسيب الكهروكيميائي للفلز (الأسهم السوداء) عند كثافات تيار مرتفعة في أوساط مائية، يحدث تفاعل انطلاق الهيدروجين (HER) على الدعامة الفلزية (\(\ce{Cu}\)) (1). وبذلك يصبح السطح مغطى جزئيًا بفقاعات \(\ce{H2}\) (2). وتعمل فقاعات \(\ce{H2}\) قوالبَ لترسيب الفلز (3). ونتيجة لذلك تتكون رغوة فلزية عالية المسامية (4)
الشكل 2. رغوات \(\ce{Cu}\) الناتجة عن الترسيب الكهربائي لـ \(\ce{Cu}\) بتيار ثابت عند كثافة تيار \(j=-3\ \mathrm{A\,cm^{-2}}\). أُوقف الترسيب في كل حالة بعد مدة مختلفة: 5 s و20 s و80 s. شريط المقياس متماثل في جميع اللوحات
2.4 بالنظر إلى هذه الآلية، عيّن زمن الترسيب الصحيح لرغوات \(\ce{Cu}\) الموضحة في الشكل 2 على ورقة الإجابة (المربعات البيضاء في الزاوية العلوية اليسرى).
تُعدّ أنظمة \(\ce{CuAg}\) ثنائية الفلز محفزات ممتازة للتخليق الكهربائي للكحولات من \(\ce{CO2}\). رُسّبت كتلة مقدارها 5.4 mg من محفز رغوي ثنائي الفلز من \(\ce{Cu}\)-\(\ce{Ag}\) (90 % كتليًا من \(\ce{Cu}\)، \(M_{\ce{Cu}}=63.546\ \mathrm{g\,mol^{-1}}\)؛ و10 % كتليًا من \(\ce{Ag}\)، \(M_{\ce{Ag}}=107.868\ \mathrm{g\,mol^{-1}}\)) بتيار ثابت على رقيقة من \(\ce{Cu}\) (\(1\ \mathrm{cm^2}\)) عند كثافة تيار \(j=-3\ \mathrm{A\,cm^{-2}}\) طُبّقت لمدة 20 s (تشير الإشارة السالبة إلى عملية اختزال/عملية مهبطية).
2.5 احسب الكفاءة الفارادية (FE بوحدة %) لعملية ترسيب الفلز هذه. تُعرَّف FE بالعلاقة \((Q_\mathrm{product}/Q_\mathrm{total})\times100\%\)، حيث يرمز \(Q\) إلى الشحنة.
ننظر في تجربة للتحليل الكهربائي لـ \(\ce{CO2}\) أُجريت في 35 mL من محلول إلكتروليت \(\ce{KHCO3}\) بتركيز 0.5 M مشبع بـ \(\ce{CO2}\)، باستخدام المحفز الرغوي ثنائي الفلز \(\ce{Cu}\)-\(\ce{Ag}\) (90 % كتليًا من \(\ce{Cu}\)؛ و10 % كتليًا من \(\ce{Ag}\)). أُجري التحليل الكهربائي لـ \(\ce{CO2}\) عند كثافة تيار (كلية) ثابتة مقدارها \(j(\mathrm{tot})=-30\ \mathrm{mA\,cm^{-2}}\) لمدة 3600 s (لاحظ أن كثافة التيار محسوبة بالنسبة إلى المساحة السطحية الهندسية البالغة \(1\ \mathrm{cm^2}\)؛ وتشير الإشارة السالبة إلى عملية اختزال/عملية مهبطية). أظهر تحليل النواتج، الذي أُجري بعد التحليل الكهربائي، تركيزين كتليين مقدارهما \(41.3\ \mathrm{mg\,L^{-1}}\) و\(7.4\ \mathrm{mg\,L^{-1}}\) للإيثانول وn-بروبانول، على الترتيب. كلا الكحولين من نواتج التفاعل السائلة، ويتراكمان في الإلكتروليت أثناء تفاعل التحليل الكهربائي. نفترض أن الهيدروجين الغازي (\(\ce{H2}\)) يتكون بوصفه الناتج الجانبي الوحيد للعملية.
2.6 احسب كثافتي التيار اللازمتين لتكوين (a) الإيثانول (\(M_\mathrm{EtOH}=46.08\ \mathrm{g\,mol^{-1}}\)) و(b) n-بروبانول (\(M_\mathrm{PrOH}=60.10\ \mathrm{g\,mol^{-1}}\))، بافتراض أن كثافتي التيار لا تتغيران مع زمن التحليل الكهربائي.
2.7 احسب حجم الهيدروجين المتكوّن على مساحة المحفز البالغة \(1\ \mathrm{cm^2}\) عند 298.15 K و1 bar، بافتراض السلوك المثالي للهيدروجين المتكوّن وانطلاقه بالكامل إلى الطور الغازي. إذا لم تحصل على نتيجة في المهمة 2.6، فتابع باستخدام FE(EtOH) = 45,1 % وFE(PrOH) = 4.8 %.
نص المسألة مترجم عن النص الإنجليزي الرسمي.
المسألة 3: البناء الضوئي الاصطناعي
يهدف مجال أبحاث البناء الضوئي الاصطناعي إلى تخزين الطاقة الشمسية في الروابط الكيميائية. تُمتص الفوتونات بإثارة مواد مُحسِّسة، مما يؤدي إلى تكوين حالة انفصال للشحنات. يُنقل الإلكترون المثار إلى حفاز (حفاز توليد الهيدروجين، HEC)، يُختزل مرتين ثم يُنتج \(\ce{H2}\). وغالبًا ما يكون المُحسِّس الضوئي أو ماصّ الضوء هو \(\ce{[Ru(bpy)3]^2+}\) (bpy = 2,2'-ثنائي البيريدين)، وغالبًا ما تكون حفازات توليد الهيدروجين معقّدات للكوبالت.
الجوانب الطاقية لشطر الماء
3.1 احسب إنثالبي التفاعل \(\ce{H2 -> 2H+(aq) + 2e-}\).
إنثالبي استذواب البروتون: \(\Delta_{\mathrm{aq}}H(\ce{H+})=-1190\ \mathrm{kJ\,mol^{-1}}\)
طاقة تأيّن الهيدروجين: \(IE_1=13.6\ \mathrm{eV}\)
إنثالبي تفكّك \(\ce{H2}\): \(\Delta_{\mathrm{diss}}H(\ce{H2})=432\ \mathrm{kJ\,mol^{-1}}\)
في الحالة المثالية، يجري الشطر الكهروكيميائي للماء إلى \(\ce{O2}\) و\(\ce{H2}\) عند جهد 1.23 V. وبما أن \(T\Delta S\) لهذه العملية موجب، فإنها تحتاج إلى حرارة من الوسط المحيط. وإذا ولّد جهد إضافي الحرارة اللازمة لتعويض الانخفاض في درجة الحرارة، تُسمّى العملية متعادلة حراريًا. إن إنثالبي تكوّن \(\ce{H2O}\)، أي \(\Delta_{\mathrm f}H^\circ(\ce{H2O})\)، يساوي \(-285\ \mathrm{kJ\,mol^{-1}}\).
3.2 احسب (a) إنتروبي تفاعل شطر الماء \(\Delta_{\mathrm r}S^\circ\) عند 25 °C لمقدار 1 mol من \(\ce{H2O}\)، و(b) الجهد الذي يكون عنده شطر الماء متعادلًا حراريًا.
الحفازات
تُعدّ المعقّدات من نوع كوبالت–سالين (سالكومين) حفازات محتملة لتكوين \(\ce{H2}\) من البروتونات والإلكترونات. تُعطى بنية السالكومين أدناه:
الشكل 1. بنية السالكومين
3.3 حدّد حالة أكسدة ذرة الكوبالت في السالكومين. وحدّد البنية الهندسية حول مركز الكوبالت في السالكومين، باختيار أحد الاحتمالات الثلاثة الآتية: رباعية السطوح، أو مربعة مستوية، أو ثمانية السطوح.
في المحلول، يستطيع السالكومين الارتباط بـ\(\ce{O2}\)؛ فيربط الأخير وحدتي سالكومين من خلال التناسق مع مركزي Co. وتصبح حالة أكسدة كلا مركزي Co عندئذٍ +III.
3.4 ارسم البنية الناتجة.
يحدث تكوّن \(\ce{H2}\) حصرًا عند مركز الكوبالت. ويُوصف التفاعل بدورة حفزية مؤلفة من 4 خطوات، تبدأ بـ\(\ce{Co^2+}\) وتستخدم 2 \(\ce{H+}\) وإلكترونين. وخلال إحدى الخطوات، يتكوّن هيدريد بانتقال إلكتروني داخل الجزيء.
3.5 اكتب مسارين محتملين للدورة الحفزية، مع بيان شحنات المعقّد وحالات أكسدة مركز Co. يجب ألّا تتجاوز حالة أكسدة مركز Co القيمة +III. علّم خطوة تكوّن الهيدريد بنجمة، ورمّز إلى اكتساب \(\ce{H+}\) بالحرف C (تفاعل كيميائي)، وإلى اكتساب الإلكترون بالحرف E (تفاعل كهروكيميائي)؛ انظر الدورة النموذجية في الشكل 2 أدناه. يرمز \(\ce{[Co^{II}]}\) إلى معقّد كوبالت–سالين.
الشكل 2. دورة نموذجية للمطلوب 3.5
3.6 باستخدام قيم جهود الأكسدة والاختزال لمعقّدات الكوبالت المختلفة المعطاة في الجدول 1، اكتب أيّ المعقّدات مناسب لـ a) أكسدة الماء عند pH متعادل، وb) اختزال الماء عند pH متعادل. اكتب التفاعل الكلي الموافق لكلتا العمليتين (للمعقّدات القادرة على إجرائه فقط)، واحسب جهد الخلية عند pH متعادل. جهد نصف الخلية لاختزال البروتون عند pH = 7 و\(T=298\ \mathrm K\) هو \(-0.41\ \mathrm V\).
زوج الأكسدة والاختزال Co(III/II) \(E^\circ\) بالنسبة إلى قطب الهيدروجين العادي \(\ce{[Co(H2O)6]}^{3+/2+}\) \(+1.92\ \mathrm V\) \(\ce{[Co(C2O4)3]}^{3-/4-}\) \(+0.55\ \mathrm V\) \(\ce{[Co(EDTA)]}^{1-/2-}\) \(+0.38\ \mathrm V\) \(\ce{[Co(NH3)6]}^{3+/2+}\) \(+0.06\ \mathrm V\) \(\ce{[Co(en)3]}^{3+/2+}\) \(-0.18\ \mathrm V\) \(\ce{[Co(CN)5]}^{2-/3-}\) \(-0.60\ \mathrm V\) الجدول 1. أزواج الأكسدة والاختزال الممكنة للمطلوب 3.6؛ \(\ce{[C2O4]^2-}\) = أكسالات، en = 1,2-إيثيلين ثنائي الأمين.
لمحة عن العملية الطبيعية
المخزن الطبيعي لمكافئات \(\ce{H2}\) الحيوية هو NADPH، الذي يُنتج من \(\ce{NADP+}\) بإضافة أيون هيدريد. وتُعرض بنية NADPH في الشكل 3.
الشكل 3. بنية NADPH
3.7 ارسم بنية \(\ce{NADP+}\).
للكلوروفيل معامل انطفاء يبلغ نحو \(\varepsilon=8\times10^4\ \mathrm{M^{-1}\,cm^{-1}}\) عند 680 nm.
3.8 بافتراض كفاءة (من الفوتون إلى ذرة الهيدروجين) مقدارها \(\phi=20\ \%\) عند تدفّق فوتوني بطول موجي 680 nm مقداره \(100\ \mathrm{nE\,s^{-1}\,cm^{-2}}\) (1 E = 1 mol من الفوتونات)، احسب a) عدد الفوتونات في الثانية، وb) تركيز الكلوروفيل في خلية أبعادها \(1\times1\times1\ \mathrm{cm^3}\) اللازم للحصول على تواتر دوران حفزي مقداره \(1\ \mathrm{nmol}\ (\ce{H2})\ \mathrm{s^{-1}}\).
نص المسألة مترجم عن النص الإنجليزي الرسمي.
المسألة 4: المركبات المفلورة وفائقة التكافؤ
يُكوِّن الفلور مركبات مستقرة وقابلة للعزل مع جميع العناصر تقريبًا، بما فيها الغازان النبيلان \(\ce{Kr}\) و\(\ce{Xe}\). وغالبًا ما تتسم الجزيئات المحتوية على الفلور ببنى غير مألوفة. ولذلك، كثيرًا ما يشارك الفلور في تكوين مركبات مع عناصر المجموعات 14–18، تُعرَّف بأنها فائقة التكافؤ. ويعتمد اصطناع المركبات العضوية المفلورة حاليًا اعتمادًا كبيرًا على توافر كواشف مصممة خصيصًا، ومنها المركب 4 أدناه.
تلميح: قد يظهر أي عنصر \(E\) في السلسلة \(\mathbf{E^1}\)–\(\mathbf{E^8}\) أكثر من مرة.
الجزء I. الهندسة الجزيئية
4.1 حدِّد العناصر \(\mathbf{E^1}\)، و\(\mathbf{E^2}\)، و\(\mathbf{E^3}\)، و\(\mathbf{E^4}\) في الأنواع الكيميائية الثلاثة 1، و\(\mathbf{[2]^-}\)، و\(\mathbf{[3]^-}\).
1: جزيء متعادل، وليس أيونًا مزدوجًا، هندسة \(\mathbf{E^1}\) هرمية مربعة، وهندسة \(\mathbf{E^2}\) ثمانية السطوح، متوسط \(d(E^1\!-\!\ce{F})=1.91\ \text{Å}\)؛ متوسط \(d(E^2\!-\!\ce{F})=1.58\ \text{Å}\)
\(\mathbf{[2]^-}\): أنيون، هرمي مربع، متوسط \(d(E^3\!-\!\ce{F})=1.96\ \text{Å}\)
\(\mathbf{[3]^-}\): أنيون، خماسي مستوٍ، \(d(E^4\!-\!\ce{F})=1.98\ \text{Å}\)
تلميحان:
- تشير الهندسات الجزيئية إلى ترتيب الذرات المرتبطة بـ \(E^1\)–\(E^4\)
- يعطي التحليل العنصري للمركب 1 محتوى كربون مقداره 17.75 % كتليًا.
المجموعة 15 المجموعة 16 المجموعة 17 المجموعة 18 \(d(\ce{P-F})=1.50\text{–}1.68\ \text{Å}\) \(d(\ce{S-F})=1.52\text{–}1.60\ \text{Å}\) \(d(\ce{Cl-F})=1.63\text{–}1.85\ \text{Å}\) \(d(\ce{As-F})=1.68\text{–}1.72\ \text{Å}\) \(d(\ce{Se-F})=1.75\text{–}1.80\ \text{Å}\) \(d(\ce{Br-F})=1.77\text{–}1.97\ \text{Å}\) \(d(\ce{Kr-F})=1.77\text{–}1.89\ \text{Å}\) \(d(\ce{Sb-F})=1.85\text{–}2.05\ \text{Å}\) \(d(\ce{Te-F})=1.80\text{–}2.00\ \text{Å}\) \(d(\ce{I-F})=1.90\text{–}2.00\ \text{Å}\) \(d(\ce{Xe-F})=1.77\text{–}2.00\ \text{Å}\) الجدول 1. النطاقات النموذجية لأطوال روابط \(\ce{E-F}\) لمجموعة مختارة من عناصر المجموعات 15–18
4.2 اختر العنصرين \(\mathbf{E^5}/\mathbf{E^6}\) والعنصرين \(\mathbf{E^7}/\mathbf{E^8}\)، على الترتيب، اللذين يُظهران الهندسة المعطاة، مع أطوال روابط \(\ce{E-F}\) قريبة من تلك الموجودة في 1 (انظر الجدول 1).
الجزء II. التفاعلية والبنية
تأمل التفاعل الموضح أدناه:
4.3 اختر الهندسة المثالية للمركب 6 من حيث ترتيب مجالات أزواج إلكترونات غلاف التكافؤ حول ذرة \(\ce{Te}\):
- مربعة مستوية
- هرمية مربعة
- ثنائية الهرم ثلاثية القاعدة
- رباعية السطوح
- ثمانية السطوح
أعطِ زوايا الروابط المثالية المتوقعة \(C^1\!-\!\ce{Te}\!-\!\ce{I}\)، و\(C^2\!-\!\ce{Te}\!-\!\ce{I}\)، و\(\ce{I-Te-O}\)، و\(C^1\!-\!\ce{Te}\!-\!C^2\).
4.4 اكتب عدد إشارات الرنين المغناطيسي النووي \({}^{1}\mathrm{H}\)-NMR التي تتوقعها لمجموعتي الميثيل في المركبين 4 و6، على الترتيب.
4.5 يتفاعل المركب 6 بالتتابع مع \(\ce{AgF}\) و\(\ce{(H3C)3SiCF3}\) (\(\ce{TMSCF3}\)). اكتب صيغتي الوسيط A والناتج النهائي B المحتويين على \(\ce{Te}\)، مع بيان هندستهما الصحيحة، وكذلك الناتجين الثانويين C وD. ارسم A وB واكتب الناتجين الثانويين C وD. تلميح: الكتلة الجزيئية لـ D هي \(92.08\ \mathrm{g\,mol^{-1}}\).
افترض أن المركب 6 يتفاعل مع حمض لويس ذي ضخامة فراغية، كيرالي ونقي إنانتيومريًا، مثل مشتق البورون المعروف 8، كما هو موضح أدناه. يُفترض أن يؤدي هذا التفاعل إلى تكوُّن ناتج جديد 9، يقابل تركيبه مجموع 6 و8. وافترض أيضًا أن 9 ملح، يُشتق كاتيونه من 6 وأنيونه من 8.
4.6 ارسم بنية كل من الكاتيون المحتوي على \(\ce{Te}\) والأنيون المحتوي على البورون، واختر الهندسة المثالية للكاتيون من حيث ترتيب مجالات أزواج إلكترونات غلاف التكافؤ حول ذرة \(\ce{Te}\).
تلميح: استخدم التمثيل التخطيطي التالي للمركب 8 (الكيرالي والنقي إنانتيومريًا):
اختر الهندسة الجزيئية المثالية للكاتيون:
- مربعة مستوية
- مثلثية مستوية
- هرمية ثلاثية
- ثنائية الهرم ثلاثية القاعدة
- رباعية السطوح
4.7 اذكر عدد الأملاح 9 الممكنة المختلفة كيميائيًا فراغيًا.
الجزء III. اصطناع ثنائي فلورو يودان من النمط \(\lambda^3\) والدوران حول رابطة أحادية
يُحضَّر المركب 10 من المادة الابتدائية 8 بالأكسدة بحمض ثلاثي كلورو إيزوسيانوريك (TCICA، 9) بوجود فائض من \(\ce{KF}\) في أسيتونتريل جاف، كما هو موضح أدناه.
4.8 اكتب تفاعلي نصفي الخلية الموزونين وتفاعلًا كليًا موزونًا لهذه العملية.
تلميح: اختصر 10 بالصيغة \(\ce{R-I}\)، و11 بالصيغة \(\ce{R-IF2}\)، وTCICA بالصيغة \(\ce{C3Cl3N3O3}\). تبقى الحلقة السداسية لـ TCICA سليمة عند الاختزال.
يمكن لمجموعة \(\ce{IF2}\) في 12 أن تدور حول رابطة \(\ce{I-C}\) (تخيَّل مروحة جزيئية). وقد قيس حاجز الدوران المقابل تجريبيًا، \(E_\mathrm{a}=30\ \mathrm{kJ\,mol^{-1}}\). علاوة على ذلك، يبلغ ثابت سرعة الدوران \(k=2500\ \mathrm{s^{-1}}\) عند \(228\ \mathrm{K}\).
4.9 حدِّد مدى سرعة دوران مجموعة \(\ce{IF2}\) من حيث المبدأ عند درجة حرارة الغرفة (\(298\ \mathrm{K}\)). تعامل مع هذه العملية كما لو كانت تفاعلًا كيميائيًا تحدِّد ثابت سرعته. اكتب إجابتك في ورقة الإجابة. ينبغي التعبير عن وحدة الثابت بـ \(\mathrm{s^{-1}}\).
نص المسألة مترجم عن النص الإنجليزي الرسمي.
المسألة 5: نزع الكبريت بالهدرجة
يُعدّ إنتاج وقود خالٍ من الكبريت التوجّه العام نحو خفض انبعاثات المركّبات المحتوية على الكبريت والسامّة للبيئة. ولإزالة الكبريت، تُستخدم في المصافي عملية نزع الكبريت بالهدرجة بمساعدة الهيدروجين.
5.1 ارسم بُنى نواتج نزع الكبريت من الثيوفين بالهدرجة من A إلى E، علمًا بأن A وB متماكبان موضعيان حلقيان وأن C حلقي.
الشكل 1. عملية نزع الكبريت من الثيوفين بالهدرجة
للكبريت نظيران طبيعيان مستقرّان هما الأكثر شيوعًا، وهما \(\ce{^{32}S}\) و\(\ce{^{34}S}\)، بوفرة مولية نسبية تبلغ \(x(\ce{^{32}S})=94.8\,\%\) و\(x(\ce{^{34}S})=4.37\,\%\)، على الترتيب. أمّا الهيدروجين، فنظيراه الطبيعيان المستقرّان هما \(\ce{^{1}H}\) و\(\ce{^{2}H}\) (\(\ce{D}\))، بوفرة مولية نسبية تبلغ \(x(\ce{^{1}H})=99.986\,\%\) و\(x(\ce{^{2}H})=0.014\,\%\)، على الترتيب.
5.2 مع الاقتصار على النظائر المذكورة أعلاه، اذكر جميع الأنواع الجزيئية النظيرية لـ\(\ce{H2S}\).
5.3 مع الاقتصار على النظائر المذكورة أعلاه، اذكر جميع الأنواع الجزيئية النظيرية لـ\(\ce{H2S}\) التي تحتوي في الوقت نفسه على نوى \(\ce{D}\) و\(\ce{^{34}S}\)، واحسب الوفرة المولية النسبية لكلٍّ منها بوحدة %.
نزع الكبريت عملية حفزية تُجرى عادةً باستخدام حفّاز \(\ce{MoS2}\) المحمول على \(\ce{SiO2}\) (\(\ce{MoS2}/\ce{SiO2}\)). ولدراسة سطح الحفّاز، يمكن استخدام طرائق التبادل النظائري. يحدث تفاعل التبادل النظائري عند السطح البيني بين الغاز والصلب، مما يؤدي إلى تبادل ذرات السطح وحدها. وفي التقريب الأول، لا تشارك الذرات في داخل المادة في التبادل (الشكل 2).
في التجربة، دُرس التبادل النظائري بين حفّاز \(\ce{MoS2}/\ce{SiO2}\) (الكسر الكتلي لـMo هو \(w_{\mathrm{Mo}}=4.280\,\%\)، ويحتوي في البداية على \(\ce{^{32}S}\) فقط) وغاز \(\ce{H2^{34}S}\) الموسوم نظائريًا، في مفاعل جريان (الشكل 2). أُبقي حفّاز \(\ce{MoS2}/\ce{SiO2}\) (\(m_{\mathrm{cat}}=1.2350\,\mathrm{g}\)) في تيار (\(p=1.00\,\mathrm{bar}\)، \(v=20.0\,\mathrm{mL\,min^{-1}}\)، \(T=23.0\,^\circ\mathrm{C}\)) من مزيج غازي يحتوي على \(\ce{H2^{34}S}\) ويُستكمل باقيه بغاز \(\ce{Ar}\) (الكسر الحجمي \(\varphi(\ce{H2^{34}S})=1.00\,\%\)، والنقاوة النظيرية لـ\(\ce{^{34}S}\) هي \(\alpha=99.95\ \text{mol.}\,\%\)). كانت مدة التجربة \(t=10.0\,\mathrm{min}\)، وجُمع الغاز الخارج طوال مدة التجربة. وكان الكسر المقاس لنظير \(\ce{^{34}S}\) بين ذرات الكبريت (\(\gamma\)) في الطور الغازي المجمّع هو \(\gamma=87.3\ \text{mol.}\,\%\). افترض سلوك الغاز المثالي، وأن التركيب العنصري (وليس النظائري!) لـ\(\ce{MoS2}\) على السطح وفي الداخل متماثل، وأن جميع ذرات الكبريت على السطح قد تبادلت مع الطور الغازي بحلول نهاية التجربة.
الشكل 2. تمثيل تخطيطي للتجربة في أثنائها (A) وفي مرحلتها النهائية (B). تظهر ذرات الكبريت على السطح باللون الأحمر، وتظهر ذرات الكبريت في الداخل باللون الأزرق. لم تُرسم ذرات الموليبدينوم.
5.4 احسب كمية ذرات الكبريت المتبادلة \(n(\ce{S})_{\mathrm{surface}}\) بوحدة mol.
إذا لم تتمكّن من حساب كمية ذرات الكبريت المتبادلة، فاستخدم القيمة \(1.53\times10^{-5}\,\mathrm{mol}\) في جميع الحسابات التالية.
افترض أن طور \(\ce{MoS2}\) يتكوّن من جسيمات كروية متماثلة، وأن جميع ذرات الكبريت الموجودة على السطح قد تبادلت في نهاية التجربة، بينما لم تشارك الذرات الداخلية في تفاعل التبادل. كثافة \(\ce{MoS2}\) هي \(\rho=5.06\,\mathrm{g\,cm^{-3}}\)، ومتوسط المساحة التي تشغلها ذرات \(\ce{S}\) و\(\ce{Mo}\) على السطح يساوي \(A_{\mathrm{S}}=3.00\times10^{-19}\,\mathrm{m^2}\) و\(A_{\mathrm{Mo}}=5.00\times10^{-19}\,\mathrm{m^2}\)، على الترتيب. يمكن حساب مساحة سطح كرة نصف قطرها \(R\) بالعلاقة \(S=4\pi R^2\)، وحجمها بالعلاقة \(V=(4/3)\pi R^3\). افترض أن التركيب النظائري لا يؤثر في كثافة \(\ce{MoS2}\).
5.5 احسب نصف قطر جسيمات \(\ce{MoS2}\)، أي \(R\). أعطِ إجابتك بوحدة nm.
في الواقع، تنتشر الذرات الموسومة نظائريًا من السطح إلى الداخل، وتنتقل الذرات غير الموسومة من الداخل إلى السطح، فتخضع لتبادل تدريجي (الشكل 3A). لذلك، في لحظة معيّنة، يتناقص كسر الذرات الموسومة داخل الجسيم من سطحه إلى مركزه. وفي الوقت نفسه، تزداد مشاركة الذرات الداخلية في تفاعل التبادل مع زيادة زمن التبادل، كما هو موضّح تخطيطيًا في الشكل 3B.
الشكل 3. A) تمثيل تخطيطي لانتشار نظائر الكبريت من السطح إلى الداخل في جسيم من \(\ce{MoS2}\). تظهر ذرات الكبريت على السطح باللون الأحمر، وتظهر ذرات الكبريت في الداخل باللون الأزرق. لم تُرسم ذرات الموليبدينوم. B) كسر ذرات \(\ce{^{34}S}\) في الداخل بدلالة الزمن والمسافة من مركز الجسيم؛ يمثّل \(r_{\mathrm{edge}}\) نصف قطر جسيم \(\ce{MoS2}\).
في نهاية التجربة، تكون ذرات السطح قد تبادلت بالكامل، ويكون جزء من الذرات الداخلية قد تبادل أيضًا بفعل الانتشار. يمكن حساب نسبة الذرات الداخلية المتبادلة، \(n(\ce{S})_{\mathrm{bulk}}^{\mathrm{ex}}\)، إلى مجموع ذرات الكبريت الداخلية، \(n(\ce{S})_{\mathrm{bulk}}^{\mathrm{total}}\)، كما يأتي:
\[ F=n(\ce{S})_{\mathrm{bulk}}^{\mathrm{ex}}/ n(\ce{S})_{\mathrm{bulk}}^{\mathrm{total}} =1-\exp(-Dt/R^2) \]
حيث \(t\) هو زمن تجربة التبادل (الموصوفة أعلاه)، و\(R\) نصف قطر الجسيم، و\(D\) معامل الانتشار. دُرس الحفّاز الموصوف أعلاه بصورة مستقلة باستخدام المجهر الإلكتروني، الذي أظهر أن جسيمات \(\ce{MoS2}\) كرات موزّعة بانتظام يبلغ نصف قطرها \(35.0\,\mathrm{nm}\).
5.6 باستخدام \(R=35.0\,\mathrm{nm}\) وبيانات تجربة التبادل الموصوفة أعلاه، احسب معامل الانتشار \(D\) (بوحدة \(\mathrm{m^2\,s^{-1}}\)) لانتشار ذرات الكبريت في \(\ce{MoS2}\). استخدم في حساباتك التقريب \(e^x\approx1+x\) عندما يكون \(x\ll1\).
نص المسألة مترجم عن النص الإنجليزي الرسمي.
المسألة 6: التحويل المباشر للميثان إلى ميثانول
يتوافر الميثان على نطاق واسع في صورة غاز طبيعي، مما يجعله مادة أولية جذابة للصناعة الكيميائية، مثل إنتاج الميثانول. غير أن التحكم في هذه العملية يمثل تحديًا، إذ يتأكسد الميثانول بسهولة أكبر من الميثان. ويُتجنَّب الإفراط في الأكسدة باستخدام عملية التدوير الكيميائي، حيث توفر المواقع النشطة في حفازات الزيوليت المتبادلة أيونيًا بالنحاس ذرة الأكسجين الوحيدة اللازمة للأكسدة إلى الميثانول، وتُستهلك هذه المواقع. وفي خطوة ثانية، يُجدَّد الحفاز بالأكسجين في غياب الميثان. يوضح المخطط أدناه موقعين محتملين للنحاس ذوي نشاط حفزي. وخلال التفاعل، يُختزل Cu(II) إلى Cu(I).
6.1 أعطِ عدد مواقع S1 وعدد مواقع S2 اللازمين لأكسدة جزيء ميثان واحد إلى ميثانول.
في غياب الأكسجين، لا يتحرر الميثانول المتكوّن من الزيوليت بإزالة الامتزاز. وإذا أُجري التفاعل في وعاء ثابت الحجم ودرجة الحرارة (أوتوكلاف)، فإن انخفاض الضغط ينتج فقط عن استهلاك الميثان، الذي يمكن اعتباره غازًا مثاليًا. في أوتوكلاف حجمه 1 L يحتوي على 200 mg من الزيوليت المحمَّل بالنحاس بنسبة كتلية 4.3 %، انخفض ضغط الميثان الابتدائي \(p_0 = 933\ \mathrm{Pa}\) إلى \(p_\infty = 925\ \mathrm{Pa}\) بعد اكتمال التفاعل عند 528 K.
6.2 احسب النسبة المئوية للنحاس الذي تفاعل.
6.3 رُسمت البيانات التجريبية في الشكل 1. استنادًا إليها، حدِّد الرتبة (الظاهرية) لأكسدة \(\ce{CH4}\).
(a) التفاعل من الرتبة الصفرية (الظاهرية).
(b) التفاعل من الرتبة الأولى (الظاهرية).
(c) التفاعل من الرتبة الثانية (الظاهرية).
الشكل 1. رسم بياني شبه لوغاريتمي لضغط الميثان المُطبَّع بدلالة الزمن للتفاعل مع الزيوليت المحمَّل بالنحاس والمحتوي على مواقع S1 وS2 في أوتوكلاف عند درجات حرارة مختلفة. تشير الرموز إلى نقاط البيانات التجريبية. والخطوط المتصلة هي ملاءمات خطية لنطاقات زمنية مناسبة. أما الخطوط المنقطة فهي أدلة بصرية
6.4 اكتب قانون السرعة (الظاهري) لأكسدة \(\ce{CH4}\) المتوافق مع البيانات التجريبية في الظروف المعطاة. لاحظ أنه قد يعتمد على تراكيز \(\ce{CH4}\) وكذلك مواقع S1 وS2 وعلى ثوابت السرعة.
6.5 اختر العبارة أو العبارات الصحيحة.
(a) يتفاعل نوعان على الأقل من مواقع النحاس، ولكل منهما ثابت سرعة مختلف.
(b) تكون الأكسدة الكلية للميثان بواسطة الزيوليت أسرع عند درجة حرارة أعلى.
(c) عند درجة حرارة أعلى، يكون جزء أكبر من مواقع النحاس قد تفاعل مع الميثان بعد اكتمال التفاعل.
(d) يصبح أحد التفاعلات أبطأ عند درجة حرارة أعلى.
يمكن رصد مواقع S1 البارامغناطيسية باستخدام مطيافية الرنين البارامغناطيسي الإلكتروني (EPR)، في حين أن مواقع S2 الديامغناطيسية لا تعطي إشارة EPR. تقيس مطيافية EPR عدد اللفّات المغزلية الإلكترونية. ومن ثم، فإن عدد مواقع S1 يتناسب طرديًا مع التكامل المزدوج \(I_2\) لطيف EPR، أي \([\mathbf{S1}] \propto I_2\). قِيست الأطياف عند درجات حرارة مختلفة \(T\)، وعند كل درجة حرارة في أزمنة مختلفة، \(t\)، بعد بدء التفاعل.
6.6 اشتق المعادلة الخطية بدلالة الزمن التي تربط \(I_2(t)\) بثابت سرعة اختفاء مواقع S1.
6.7 ضع علامة في المربعات على ورقة الإجابة لكل قياس يحتاج إلى معايرة باستخدام معيار معلوم من Cu(II).
(a) العدد الكلي لمواقع Cu(II) البارامغناطيسية في العينة.
(b) تركيز مواقع Cu(II) البارامغناطيسية في العينة.
(c) ثابت السرعة.
(d) أنواع أصناف Cu(II) البارامغناطيسية المختلفة في العينة.
من قياسات EPR، يُعلَم أن ثابت سرعة التفاعل مع مواقع S1 عند 528 K هو \(2.604 \times 10^{-3}\ \mathrm{s^{-1}}\).
6.8 بالنظر إلى الشكل 1 وبالاستناد إلى حساب، حدِّد ما إذا كان الميثان يتفاعل مع مواقع S2 أسرع أم أبطأ من تفاعله مع مواقع S1.
(a) يتفاعل الميثان أسرع مع S1.
(b) سرعتا التفاعلين متساويتان.
(c) يتفاعل الميثان أسرع مع S2.
يمكن تحويل الميثانول لاحقًا إلى أوليفينات قيّمة باستخدام حفازات زيوليت مختلفة. وفي هذه العملية، يُلاحَظ ناتج وسيط كتلته المولية \(86.09\ \mathrm{g\,mol^{-1}}\)، وتحليله العنصري (55.8 % كتليًا من \(\ce{C}\)، و7.0 % كتليًا من \(\ce{H}\))، وله طيف رنين مغناطيسي نووي (NMR) لـ \({}^{1}\mathrm{H}\) يتألف من إشارات عند أربع إزاحات كيميائية مختلفة:
a: 12.2 ppm (1H, s)، عريضة، تختفي عند إضافة \(\ce{D2O}\)
b: 6.3 ppm (1H, d)
c: 5.7 ppm (1H, d)
d: 2.0 ppm (3H, s)
6.9 ارسم بنية الناتج الوسيط وعيِّن البروتونات a وd.
صنّفت وزارة الطاقة الأمريكية اثني عشر مركبًا كيميائيًا لا تحتوي إلا على \(\ce{C}\) و\(\ce{H}\) و\(\ce{O}\) بوصفها مواد كيميائية منصة. وهذه أكثر المواد المرشحة الواعدة، إذ يسهل تحضيرها من موارد متجددة، ويمكن تحضير مشتقات مستهدفة متعددة منها. أحدها هو المركب A، الذي يمكن إما تحضير مشتقات أخرى منه أو استخدامه، على سبيل المثال، في التطبيقات الطبية أو في المنظفات.
- طيف NMR لـ \({}^{1}\mathrm{H}\) في DMSO: 7.81 ppm (a، أحادية)، و13.0 ppm (b، أحادية، عريضة، تختفي عند إضافة \(\ce{D2O}\))، وللإشارتين التكامل نفسه.
- طيف NMR لـ \({}^{13}\mathrm{C}\): 165.1 ppm (1)، و150.6 ppm (2) و120.6 ppm (3).
- \(M = 156.03\ \mathrm{g\,mol^{-1}}\). التحليل العنصري: 46.15 % كتليًا من \(\ce{C}\)، و2.56 % كتليًا من \(\ce{H}\).
6.10 أعطِ بنية ممكنة للمركب A وعيِّن جميع البروتونات والكربون 1.
نص المسألة مترجم عن النص الإنجليزي الرسمي.
المسألة 7: حركية الإنزيمات
تصف آلية ميكايليس–منتن (MM)، التي طُرحت عام 1913، حركية التحفيز الإنزيمي. في هذه الآلية، يحفّز الإنزيم \(\ce{E}\) تحوّل الركيزة \(\ce{S}\) إلى الناتج \(\ce{P}\):
تُعطى السرعة الابتدائية لتفاعل إنزيمي يتبع آلية MM بالعلاقة
\[ v_0=v_{\max}\frac{[\ce{S}]_0}{K_{\mathrm M}+[\ce{S}]_0} \tag{1} \]
عندما يكون التركيز الابتدائي لـ \(\ce{E}\) أقل بكثير من التركيز الابتدائي لـ \(\ce{S}\)، أي \([\ce{E}]_0\ll[\ce{S}]_0\). ويُعرَّف ثابت ميكايليس بأنه \(K_{\mathrm M}=(k_2+k_3)/k_1\). ويمكن أيضًا التعبير عن السرعة الابتدائية بحاصل ضرب التدفق النسبي \(j\) في \([\ce{E}]_0\):
\[ v_0=j[\ce{E}]_0 \tag{2} \]
ملاحظة: قد يكون لكل من السؤالين 7.1 و7.2 إجابة صحيحة واحدة أو عدة إجابات صحيحة، أو قد لا تكون له أي إجابة صحيحة.
7.1 اختر الصيغة أو الصيغ البديلة الصحيحة لتعبيري السرعة الابتدائية (\(v_0\))، (1) و(2).
يمثّل \([\ce{ES}]_{\max}\) التركيز الأقصى للمعقّد \(\ce{ES}\).
- (a) \(\displaystyle v_0=\frac{k_3[\ce{E}]_0[\ce{S}]_0}{K_{\mathrm M}+[\ce{S}]_0}\)
- (b) \(\displaystyle v_0=\frac{k_3[\ce{E}]}{K_{\mathrm M}/[\ce{S}]_0+1}\)
- (c) \(\displaystyle v_0=j[\ce{ES}]_{\max}\)
- (d) \(\displaystyle v_0=\frac{k_3[\ce{E}]_0[\ce{ES}]_{\max}}{K_{\mathrm M}+[\ce{S}]_0}\)
- (e) \(\displaystyle v_0=\frac{k_3[\ce{E}]_0}{K_{\mathrm M}/[\ce{S}]_0+1}\)
- (f) \(\displaystyle v_0=\frac{j[\ce{E}]_0}{K_{\mathrm M}+[\ce{S}]_0}\)
7.2 اختر زوج المحورين أو أزواج المحاور (\(y\) مقابل \(x\)) التي يُتوقَّع أن تعطي رسمًا بيانيًا خطيًا.
- (a) \(v_0\) مقابل \(1/[\ce{S}]_0\)
- (b) \(v_0\) مقابل \(v_0/K_{\mathrm M}\)
- (c) \(v_0\) مقابل \(K_{\mathrm M}/v_0\)
- (d) \(1/v_0\) مقابل \(v_0/[\ce{S}]_0\)
- (e) \(1/v_0\) مقابل \(v_0/K_{\mathrm M}\)
- (f) \([\ce{S}]_0/v_0\) مقابل \([\ce{S}]_0\)
تحفّز إنزيمات كثيرة تحوّلات متعددة الركائز بدلًا من تحوّلات أحادية الركيزة. ومع ذلك، إذا كان تركيز إحدى الركيزتين أعلى بكثير من تركيز الركيزة الأخرى، أو إذا أُبقي ثابتًا، فإن حركية MM تظل صالحة أيضًا. سنتناول هنا نظامين إنزيميين مستقلين يتبعان حركية MM.
النظام الإنزيمي I
يحوّل الإنزيم \(\ce{E}\) الركيزتين \(\ce{A}\) و\(\ce{B}\) إلى الناتجين \(\ce{P_A}\) و\(\ce{P_B}\). عند تحقق اتزان مسبق سريع بين الإنزيم الحر وجميع معقّدات الإنزيم–الركيزة، تنطبق المعادلة الآتية:
\[ v_0= \frac{k[\ce{E}]_0[\ce{A}]_0[\ce{B}]_0} {(K+[\ce{A}]_0)(K+[\ce{B}]_0)} \tag{3} \]
حيث \(k\) هو ثابت سرعة أحد التفاعلات. ويصف ثابت الاتزان نفسه \(K\) تفكك أي من الركيزتين عن الموقع النشط الموافق لها في \(\ce{E}\).
7.3 بيّن أن المعادلة (3) تأخذ صيغة MM الواردة في (1) إذا أُبقي تركيز الركيزة \(\ce{B}\) عند قيمة ثابتة \(c_0\). أعطِ تعبير \(v_{\max}\) في هذه الحالة.
7.4 اقترح مخططًا حركيًا لـ النظام الإنزيمي I يتوافق مع المعادلة (3)، مع إظهار جميع المركّبات الوسيطة والنواتج. حدّد التفاعل الذي ثابت سرعته \(k\).
النظام الإنزيمي II
للإنزيم \(\ce{E}\) خمسة مواقع نشطة، يختص كل منها بإحدى الركائز \(\ce{S_A}\) أو \(\ce{S_B}\) أو \(\ce{S_C}\)، التي تتحوّل انتقائيًا إلى النواتج \(\ce{P_A}\) أو \(\ce{P_B}\) أو \(\ce{P_C}\)، على الترتيب. ويوجد موقع نشط واحد على الأقل لكل ركيزة. وكل موقع نشط مستقل عن المواقع الأخرى.
بالنسبة إلى \(\ce{E}\)، تُعرف المعلومات الآتية:
-
الألفة تجاه \(\ce{S_C}\) أعلى من الألفة تجاه \(\ce{S_B}\).
-
يرد أدناه الرسم البياني لـ \(v_{0i}\) مقابل \(v_{0i}/[\ce{S_i}]_0\)، المعروف باسم مخطط إيدي–هوفستي، للركائز \(\ce{S_A}\) و\(\ce{S_B}\) و\(\ce{S_C}\)، حيث تُعطى السرعة لكل موقع نشط (\(v_{0i}\))، ولكن حُذف مقياس الرسم ومفتاحه.
-
عندما يكون \(\ce{E}\) مشبعًا بالركائز \(\ce{S_A}\) و\(\ce{S_B}\) و\(\ce{S_C}\)، يكون عدد الدورات التحفيزية (TON) للركيزة \(\ce{S_C}\) لكل موقع هو \(10200\ \mathrm{min^{-1}}\)، ويُصنَّع ما مجموعه 2023 جزيئًا من النواتج \(\ce{P_A}\) و\(\ce{P_B}\) و\(\ce{P_C}\) في الثانية. وفي الوقت نفسه، يُرصد تكوّن ما لا يزيد على \(5.94\times10^6\) جزيئًا من \(\ce{P_A}\) و\(\ce{P_B}\) في الساعة.
-
عند تراكيز متساوية مولاريًا للركائز \(\ce{S_A}\) و\(\ce{S_B}\) و\(\ce{S_C}\)، تقل عن قيم \(K_{\mathrm M,i}\) الموافقة بمعامل لا يقل عن 1000، تصبح تراكيز \(\ce{P_A}\) و\(\ce{P_B}\) و\(\ce{P_C}\) متناسبة مع الكفاءة التحفيزية \((\varepsilon_i=k_{i3}/K_{\mathrm M,i})\)، وتكون نسبتها \(3:2:5\)، على الترتيب.
-
لمعقّدين من معقّدات \(\ce{ES_i}\) ثابتا سرعة متساويان لتفككهما إلى \(\ce{E}\) و\(\ce{S_i}\). ويزيد حاجز التنشيط لتفاعل \(\ce{ES_C}\) الذي يعيد تكوين المركّبات الابتدائية بمقدار \(1266\ \mathrm{J\,mol^{-1}}\) على حاجز التنشيط لتفاعله الذي يُكوّن النواتج النهائية. افترض أن العاملين السابقين للأسّ متساويان في كلا التفاعلين، وأن \(T=25\,^\circ\mathrm C\).
-
لتفاعل \(\ce{E + S_i}\): \(k_{\mathrm{c1}}=1.57\times10^7\ \mathrm{M^{-1}\,s^{-1}}\) و\(k_{\mathrm{a1}}=k_{\mathrm{b1}}\).
7.5 أكمل الجدول أدناه وقدّم حساباتك. تلميحات:
- استخدم المعلومات الواردة في النقطتين 1 و2 لإيجاد العلاقة (\(<\)، \(>\)، \(=\)) بين الثوابت \(K_{\mathrm M,A}\) و\(K_{\mathrm M,B}\) و\(K_{\mathrm M,C}\).
- تتيح لك المعلومات الواردة في النقطتين 3 و5 إكمال العمود الأول (عدد المواقع النشطة لكل ركيزة) والصف الأخير (جميع الثوابت للركيزة \(\ce{S_C}\)) من الجدول. تحقّق من أن مجموع المواقع النشطة يساوي 5.
عدد المواقع النشطة \(k_1\) \(k_2\) \(k_3\) \(K_{\mathrm M}\) \(\ce{S_A}\) \(\ce{S_B}\) \(\ce{S_C}\) \(1.57\times10^7\ \mathrm{M^{-1}\,s^{-1}}\) نص المسألة مترجم عن النص الإنجليزي الرسمي.
المسألة 8: تفاعل نازاروف
تفاعل نازاروف هو تفاعل يُستخدم كثيرًا لتحويل كيتونات ثنائي الفينيل إلى سيكلوبنتينونات. ويجري إما ضوئيًا أو بالتحفيز الحمضي، وهو تحلّق كهروحَلَقي يعقبه انتقال بروتون.
8.1 ارسم المدارات الجزيئية π لوصف تفاعل نازاروف. وزّع الإلكترونات على مستويات الطاقة المناسبة. ضع علامة x على (i) المدار HOMO (أعلى مدار جزيئي مشغول) و(ii) المدار LUMO (أدنى مدار جزيئي غير مشغول). في هذا التمرين، يمكنك اعتبار كيتون ثنائي الفينيل كاتيون بنتاداينيل ذي خمسة مدارات p.
8.2 انطلاقًا من المدارات الجزيئية π التي اشتققتها في المهمة 8.1، توقّع الظروف التي يجري فيها تفاعل نازاروف لكيتون ثنائي الفينيل بدوران متعاكس الاتجاه أو بدوران متوافق الاتجاه. ضع علامة x في الجدول عند الظروف التي يكون فيها التفاعل مسموحًا.
دوران متعاكس الاتجاه دوران متوافق الاتجاه حراري ضوئي كيميائي 8.3 استُخدم تفاعل نازاروف بوصفه التفاعل الرئيسي في اصطناع الفارنيسين. لكلٍّ من الظرفين أدناه، ارسم بنية ممكنة لكلٍّ من A وB، مع توضيح الكيمياء الفراغية. لاحظ أن نواتج كلا التفاعلين تُظهر إشارة عند 6.70–6.73 ppm في طيف الرنين المغناطيسي النووي لـ \(\ce{^1H}\).
يبدأ اصطناع الكابنيلين بالألدهيد غير المشبع C الموضح أدناه. أدّت معالجته بـ D، ثم تفاعله مع \(\ce{MnO2}\) المحمول على الكربون، إلى كيتون ثنائي الفينيل E الموضح أدناه. وأدّت معالجته بمزيج من \(\ce{P2O5}\) وMsOH إلى F، الذي حُوِّل عبر سلسلة من التفاعلات إلى الكيتون غير المشبع I.
8.4 اختر من القائمة الكاشف أو الكواشف المناسبة لتكون D.
(a) \(\ce{H2C=CHMgBr}\) (c) \(\ce{H2C=CHBr}\)، \(\ce{Pd(PPh3)4}\)
(b) 1. \(\ce{NaBH4}\) 2. \(\ce{H2C=CHLi}\) (d) \(\ce{H2C=CHMgBr}\)، \(\ce{CuI}\)
8.5 أعطِ بُنى المركبات الوسيطة F وG وH، مع توضيح كيميائها الفراغية.
عولج الإينون I بعد ذلك بـ \(\ce{H2C=CHMgBr}\) و\(\ce{CuI}\) في THF لإعطاء المركب الوسيط J، ثم أُجري له تحلّل بالأوزون لإعطاء المركب الوسيط K، الذي يُظهر إشارة عند 9.61 ppm في طيف الرنين المغناطيسي النووي لـ \(\ce{^1H}\). وأدّت المعالجة بـ \(\ce{KOH}\) بتركيز 5-% في مزيج من THF والإيثر إلى المركب الوسيط L. وأعطت الهدرجة باستخدام حفّاز Pt وتحت جوّ من \(\ce{H2}\) المركب M، الذي أُنتج منه الكابنيلين في النهاية.
8.6 أعطِ بُنى J وK وL وM، مع توضيح كيميائها الفراغية.
نص المسألة مترجم عن النص الإنجليزي الرسمي.
المسألة 9: التحليل الكهربائي في الاصطناع العضوي
يصف تحليل كولبه الكهربائي ازدواج حمضين كربوكسيليين بنزع الكربوكسيل، ولا يحدث إلا إذا نُزع بروتون الحمض. وتُعرض هنا المعادلة غير الموزونة.
ينتج غازان (B وC) أثناء التفاعل. يتفاعل B مع \(\ce{Ca(OH)2}\)، بينما يكون C شديد الاشتعال.
9.1 أعطِ الصيغ البنائية لكلٍّ من A وB وC.
9.2 يُعدّ هذا الاصطناع صوريًّا تفاعل أكسدة واختزال، تتأكسد فيه الكربوكسيلات ويُختزل المذيب. اكتب نصفي تفاعل الأكسدة والاختزال وتفاعل الأكسدة والاختزال الكلي.
9.3 أعطِ الوسيطين 1 و2 في آلية نزع الكربوكسيل التأكسدي وتكوّن الناتج.
عادةً لا يكون تحليل كولبه الكهربائي فعّالًا إلا مع الأحماض الكربوكسيلية المشبعة طويلة السلسلة، ولا يكون كذلك مع بعض الأحماض الكربوكسيلية، مثل D. ففي هذه الحالة، تتيسّر الأكسدة الإضافية للوسيط الجذري E إلى نوع كيميائي موجب الشحنة F. ويمكن للوسيط F أن يتفاعل مع النيوكليوفيلات ليكوّن نواتج جانبية مختلفة؛ فهو يتفاعل، مثلًا، مع D ليكوّن الإستر G، ومع \(\ce{MeOH}\) ليكوّن H.
9.4 أعطِ بُنى D–H.
يؤدي التحليل الكهربائي للحمض الكربوكسيلي I بوجود فائض من الحمض المشارك J إلى ناتجين رئيسيين (وفقًا لتحليل الرنين المغناطيسي النووي لـ \({}^{1}\mathrm{H}\)) لا يمكن فصلهما باستشراب هلام السيليكا. وبياناتهما الطيفية متطابقة تقريبًا. وفي طيف الرنين المغناطيسي النووي لـ \({}^{1}\mathrm{H}\)، لا يمكن التمييز بين النوعين إلا بإشارتين تختلف إزاحتاهما الكيميائيتان اختلافًا طفيفًا.
يبدو طيف الرنين المغناطيسي النووي لـ \({}^{1}\mathrm{H}\) كما يلي (مزيج بنسبة 1:1 من الناتجين K وL):
4.18–4.08 (m, 4 H), 3.95–3.60 (m, 6 H), 3.43 (dt, 2 H, \(J=7.8,\ 2.2\ \mathrm{Hz}\)),
2.55–2.25 (m, 4 H), 2.20–1.95 (m, 2 H), 1.65–1.50 (m, 2 H)الإشارات الخاصة بـ K:
1.26 (t, 3 H, \(J=7.2\ \mathrm{Hz}\)), 1.20 (d, 3 H, \(J=6.6\ \mathrm{Hz}\))
الإشارات الخاصة بـ L:
1.24 (t, 3 H, \(J=7.2\ \mathrm{Hz}\)), 1.15 (d, 3 H, \(J=6.6\ \mathrm{Hz}\))
9.5 أعطِ بُنيتي الناتجين K وL. وبيّن العلاقة بينهما.
(a) إبيمرات (b) متماكبات مرآتية
(c) متماكبات فراغية غير مرآتية (d) متماكبات بنائية
يمكن أن يؤثر اختيار مادة القطب في انتقائية تفاعل اصطناع عضوي كهربائي. ويعطي التحليل الكهربائي الاختزالي للبنزالدهيد (M) (بتركيز 16 mM في محلول مائي من \(\ce{KOH}\) بتركيز 1 M، وبمصعد من \(\ce{Pt}\)، وعند −1.3 V بالنسبة إلى \(\ce{Ag/AgCl}\)) نواتج مختلفة بحسب مادة المهبط المستخدمة. ويعزّز الارتباط القوي بالسطح التفاعلات بين الجزيئات. ويُظهر الشكل أدناه توزيع النواتج لمواد مهبطية مختلفة وأطياف الكتلة للنواتج.
9.6 أعطِ بُنيتي N وO.
يمكن إجراء اقتران تأكسدي للألكينات، مثل إيثرات الإينول. ويتضمن ذلك عادةً الأكسدة المصعدية للجزء الألكيني لتوليد كاتيون جذري يمكن أن يلتقطه نيوكليوفيل.
9.7 أعطِ الصيغ البنائية لكلٍّ من P وQ وR وS في المخطط أدناه. لا يلزم بيان الكيمياء الفراغية. تلميح: S ناتج ثلاثي الحلقات.
نص المسألة مترجم عن النص الإنجليزي الرسمي.
المسألة 10: سويسرا — بلد المستحضرات الصيدلانية
باسيريوتيد (1) دواء قائم على الببتيدات طوّرته شركة نوفارتس السويسرية للأدوية لعلاج داء كوشينغ.
10.1 حدّد عدد المراكز المولّدة للتصاوغ الفراغي (\(n\)) في باسيريوتيد (1). احسب العدد الكلي لجميع المتصاوغات الفراغية الممكنة (\(t\)).
باسيريوتيد (1) ببتيد حلقي. ويمكن تحضير وسيط متقدم في اصطناعه (الببتيد الخطي 2) بواسطة اصطناع الببتيدات في الطور الصلب (SPPS) باستخدام استراتيجية Fmoc/tBu كما هو موضح في المخطط 1.
المخطط 1. اصطناع الببتيد 2 في الطور الصلب. i) الرابط؛ ii) الراتنج؛ iii) التحميل على الراتنج؛ iv) اصطناع الببتيدات في الطور الصلب: تكرار 1. نزع حماية Fmoc 2. اقتران الحمض الأميني + نزع حماية Fmoc النهائي؛ v) فصل الببتيد عن الراتنج ونزع حماية PG-2.
يبدأ الاصطناع بتحضير Fmoc-Tyr(Bn)-OH (3) من Boc-Tyr-OH (7).
10.2 ارسم الكاشفين A وD والوسيطين B وC في اصطناع Fmoc-Tyr(Bn)-OH (3) كما هو موضح أعلاه.
يبدأ اصطناع الوسيط 2 في الطور الصلب بربط Fmoc-Tyr(Bn)-OH (3) برابط مناسب مرتبط بالراتنج.
المخطط 2. ii) الراتنج؛ a) رابط كلوريد 2-كلوروتريتيل؛ b) رابط قفل الأمان؛ c) رابط رينك الأميدي؛ d) رابط كلوريد SASRIN؛ e) رابط سيبر الأميدي؛ f) رابط وانغ
10.3 اختر الرابط أو الروابط 4 من المخطط 2 المناسبة لاصطناع الببتيد 2 في الطور الصلب وفقًا للمخطط 1.
10.4 اختر من g–l مجموعتي حماية السلاسل الجانبية PG-1 وPG-2 الأنسب لاصطناع 2 في الطور الصلب وفقًا للمخطط 1، بحيث يمكن نزعهما بصورة متعامدة في وجود جميع المجموعات الوظيفية الأخرى الموجودة في باسيريوتيد. توجد إجابة صحيحة واحدة فقط لكل مجموعة من مجموعتي الحماية.
بعد ذلك، يخضع الببتيد الخطي 2 لتفاعل اقتران داخل الجزيء لتكوين الببتيد الحلقي 8 وفقًا للمخطط التالي:
المخطط 3. vi) قاعدة
10.5 اختر العبارة أو العبارات الصحيحة بشأن تحلّق الببتيد 2 إلى 8.
(a) من النواتج الجانبية المحتملة للتفاعل إضافة مجموعة رباعي ميثيل غوانيديل إلى وحدة الفينيل ألانين عند النهاية \(N\)، مما ينتج المركب 9 الموضح أدناه.
(b) من النواتج الجانبية المحتملة للتفاعل نزع مجموعة الحماية PG-1 والتحلّق عبر المجموعة الأمينية لوحدة الليسين لإعطاء المركب 10 الموضح أدناه.
(c) يجب إجراء التفاعل عند تركيز مرتفع للببتيد لتحقيق سرعة تفاعل كافية.
(d) يجب إجراء التفاعل عند تركيز منخفض للببتيد لمنع التكاثف المتعدد.
(e) البيبيريدين (11) أدناه قاعدة مناسبة للتفاعل.
تتضمن الخطوات الأخيرة من الاصطناع تعديل مجموعة OH في وحدة 4-هيدروكسي برولين في 8 وظيفيًا، ثم نزع جميع مجموعات الحماية لإعطاء باسيريوتيد (1).
المخطط 4. vii) يمكن استخدامه تمثيلًا مبسطًا لـ8؛ viii) نزع مجموعات الحماية
10.6 ارسم بنيتي الوسيط E (بما في ذلك الكيمياء الفراغية) والكاشف F. اختصر الوسيط 8 بالتمثيل (vii) ومجموعة الحماية بالرمز PG-1 في البنيتين E وF كما هو مبين في المخطط 5.
10.7 حدّد أقل عدد ممكن من المكافئات المولية للمركب 12 اللازمة لتمكين التحويل الكامل لـ8 إلى 13.
نص المسألة مترجم عن النص الإنجليزي الرسمي.