IChO 2003 · Theory problem 7
Titration curves of phosphate solutions
Solutions containing \(\ce{H3PO4}\) and/or \(\ce{NaH2PO4}\) are titrated with a strong base standard solution. Associate the contents of these solutions with the titration curves (\(pH\) vs. volume of titrant) shown in the figure:
(For \(\ce{H3PO4}\): \(pK_1 = 2.1,\ pK_2 = 7.2,\ pK_3 = 12.0\))
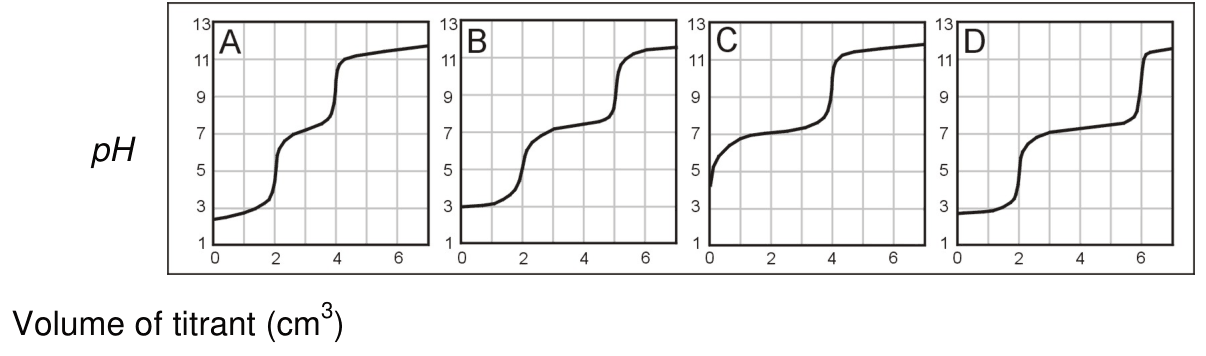
a) The sample contains \(\ce{H3PO4}\) only.
Curve A ( ), Curve B ( ), Curve C ( ), Curve D ( )
b) The sample contains both in a mole ratio \(\ce{H3PO4} : \ce{NaH2PO4} = 2 : 1\).
Curve A ( ), Curve B ( ), Curve C ( ), Curve D ( )
c) The sample contains both in a mole ratio \(\ce{H3PO4} : \ce{NaH2PO4} = 1 : 1\).
Curve A ( ), Curve B ( ), Curve C ( ), Curve D ( )
Official English text of the problem.
Answers
- a) Curve A.
- b) Curve B.
- c) Curve D.
Solution
The chemical species needed for the explanation are:
| Name | Formula | SMILES |
|---|---|---|
| Phosphoric acid | \(\ce{H3PO4}\) | O=P(O)(O)O |
| Sodium dihydrogen phosphate | \(\ce{NaH2PO4}\) | [Na+].O=P([O-])(O)O |
| Dihydrogen phosphate ion | \(\ce{H2PO4^-}\) | O=P([O-])(O)O |
| Hydrogen phosphate ion | \(\ce{HPO4^2-}\) | O=P([O-])([O-])O |
| Hydroxide ion | \(\ce{OH^-}\) | [OH-] |
| Water | \(\ce{H2O}\) | O |
Let the initial amounts of phosphoric acid and sodium dihydrogen phosphate be \(a\) and \(b\) mol, respectively. The two observed equivalence points correspond to the successive neutralizations
\[ \ce{H3PO4 + OH^- -> H2PO4^- + H2O} \]
and
\[ \ce{H2PO4^- + OH^- -> HPO4^2- + H2O}. \]
Reaching the first equivalence point requires \(a\) mol of hydroxide. At that point, the solution contains \(a+b\) mol of dihydrogen phosphate, so reaching the second equivalence point requires a further \(a+b\) mol of hydroxide.
Thus, for base concentration \(c_{\mathrm B}\) in \(\mathrm{mol\,L^{-1}}\) and cumulative equivalence-point volumes \(V_1,V_2\) in litres,
\[ c_{\mathrm B}V_1=a, \qquad c_{\mathrm B}V_2=2a+b. \]
Consequently,
\[ \boxed{\frac{V_2}{V_1}=2+\frac{b}{a}} \qquad\text{and}\qquad \boxed{a:b=V_1:(V_2-2V_1)}. \]
The widely separated \(pK_i\) values allow these neutralization stages to be distinguished. The approximate pH values at the first and second equivalence points are, respectively,
\[ \frac{pK_1+pK_2}{2}=4.65, \qquad \frac{pK_2+pK_3}{2}=9.6, \]
consistent with the two steep rises shown.
a) Phosphoric acid only
Here \(b=0\), giving
\[ V_2=2V_1. \]
Curve A has equivalence points at approximately \(2\ \mathrm{cm^3}\) and \(4\ \mathrm{cm^3}\), so it satisfies this condition. Mark Curve A.
b) Mole ratio \(\ce{H3PO4}:\ce{NaH2PO4}=2:1\)
Here \(b/a=1/2\), so
\[ \frac{V_2}{V_1}=2+\frac12=2.5. \]
Curve B has equivalence points at approximately \(2\ \mathrm{cm^3}\) and \(5\ \mathrm{cm^3}\). Equivalently,
\[ a:b = 2:(5-2\times2) = 2:1. \]
Mark Curve B.
c) Mole ratio \(\ce{H3PO4}:\ce{NaH2PO4}=1:1\)
Here \(b/a=1\), so
\[ \frac{V_2}{V_1}=3. \]
Curve D has equivalence points at approximately \(2\ \mathrm{cm^3}\) and \(6\ \mathrm{cm^3}\). Hence,
\[ a:b = 2:(6-2\times2) = 2:2 = 1:1. \]
Mark Curve D.
The remaining curve, C, corresponds to sodium dihydrogen phosphate alone. It begins near the amphiprotic dihydrogen phosphate pH, approximately \(4.65\), and has no initial phosphoric-acid neutralization step. Its prominent rise corresponds to conversion into hydrogen phosphate.
The answers were checked against the official answers published by the organisers.
IChO 2003 · Theorieaufgabe 7
Titrationskurven von Phosphatlösungen
Lösungen, die \(\ce{H3PO4}\) und/oder \(\ce{NaH2PO4}\) enthalten, werden mit der Maßlösung einer starken Base titriert. Ordnen Sie die Zusammensetzungen dieser Lösungen den in der Abbildung dargestellten Titrationskurven (\(pH\) gegen das Volumen der Maßlösung) zu:
(Für \(\ce{H3PO4}\): \(pK_1 = 2.1,\ pK_2 = 7.2,\ pK_3 = 12.0\))
a) Die Probe enthält nur \(\ce{H3PO4}\).
Kurve A ( ), Kurve B ( ), Kurve C ( ), Kurve D ( )
b) Die Probe enthält beide Stoffe im Stoffmengenverhältnis \(\ce{H3PO4} : \ce{NaH2PO4} = 2 : 1\).
Kurve A ( ), Kurve B ( ), Kurve C ( ), Kurve D ( )
c) Die Probe enthält beide Stoffe im Stoffmengenverhältnis \(\ce{H3PO4} : \ce{NaH2PO4} = 1 : 1\).
Kurve A ( ), Kurve B ( ), Kurve C ( ), Kurve D ( )
Aufgabentext aus dem offiziellen englischen Text übersetzt.
Antworten
- a) Kurve A.
- b) Kurve B.
- c) Kurve D.
Lösung
Die für die Erklärung benötigten chemischen Spezies sind:
| Name | Formel | SMILES |
|---|---|---|
| Phosphorsäure | \(\ce{H3PO4}\) | O=P(O)(O)O |
| Natriumdihydrogenphosphat | \(\ce{NaH2PO4}\) | [Na+].O=P([O-])(O)O |
| Dihydrogenphosphat-Ion | \(\ce{H2PO4^-}\) | O=P([O-])(O)O |
| Hydrogenphosphat-Ion | \(\ce{HPO4^2-}\) | O=P([O-])([O-])O |
| Hydroxid-Ion | \(\ce{OH^-}\) | [OH-] |
| Wasser | \(\ce{H2O}\) | O |
Die anfänglichen Stoffmengen an Phosphorsäure und Natriumdihydrogenphosphat seien \(a\) bzw. \(b\) mol. Die beiden beobachteten Äquivalenzpunkte entsprechen den aufeinanderfolgenden Neutralisationen
\[ \ce{H3PO4 + OH^- -> H2PO4^- + H2O} \]
und
\[ \ce{H2PO4^- + OH^- -> HPO4^2- + H2O}. \]
Zum Erreichen des ersten Äquivalenzpunkts werden \(a\) mol Hydroxid-Ionen benötigt. An diesem Punkt enthält die Lösung \(a+b\) mol Dihydrogenphosphat-Ionen, sodass zum Erreichen des zweiten Äquivalenzpunkts weitere \(a+b\) mol Hydroxid-Ionen benötigt werden.
Somit gilt für die Basenkonzentration \(c_{\mathrm B}\) in \(\mathrm{mol\,L^{-1}}\) und die bis zu den jeweiligen Äquivalenzpunkten insgesamt zugegebenen Volumina \(V_1,V_2\) in Litern:
\[ c_{\mathrm B}V_1=a, \qquad c_{\mathrm B}V_2=2a+b. \]
Daraus folgt:
\[ \boxed{\frac{V_2}{V_1}=2+\frac{b}{a}} \qquad\text{und}\qquad \boxed{a:b=V_1:(V_2-2V_1)}. \]
Die weit auseinanderliegenden \(pK_i\)-Werte ermöglichen es, diese Neutralisationsstufen zu unterscheiden. Die näherungsweisen pH-Werte am ersten bzw. zweiten Äquivalenzpunkt betragen
\[ \frac{pK_1+pK_2}{2}=4.65, \qquad \frac{pK_2+pK_3}{2}=9.6, \]
was mit den beiden dargestellten steilen Anstiegen übereinstimmt.
a) Nur Phosphorsäure
Hier ist \(b=0\), woraus folgt:
\[ V_2=2V_1. \]
Kurve A hat Äquivalenzpunkte bei etwa \(2\ \mathrm{cm^3}\) und \(4\ \mathrm{cm^3}\) und erfüllt somit diese Bedingung. Kreuzen Sie Kurve A an.
b) Stoffmengenverhältnis \(\ce{H3PO4}:\ce{NaH2PO4}=2:1\)
Hier ist \(b/a=1/2\), also gilt:
\[ \frac{V_2}{V_1}=2+\frac12=2.5. \]
Kurve B hat Äquivalenzpunkte bei etwa \(2\ \mathrm{cm^3}\) und \(5\ \mathrm{cm^3}\). Gleichwertig dazu gilt:
\[ a:b = 2:(5-2\times2) = 2:1. \]
Kreuzen Sie Kurve B an.
c) Stoffmengenverhältnis \(\ce{H3PO4}:\ce{NaH2PO4}=1:1\)
Hier ist \(b/a=1\), also gilt:
\[ \frac{V_2}{V_1}=3. \]
Kurve D hat Äquivalenzpunkte bei etwa \(2\ \mathrm{cm^3}\) und \(6\ \mathrm{cm^3}\). Daraus folgt:
\[ a:b = 2:(6-2\times2) = 2:2 = 1:1. \]
Kreuzen Sie Kurve D an.
Die verbleibende Kurve C entspricht einer Lösung, die nur Natriumdihydrogenphosphat enthält. Sie beginnt nahe dem pH-Wert des amphiprotischen Dihydrogenphosphat-Ions, etwa \(4.65\), und weist keine anfängliche Neutralisationsstufe der Phosphorsäure auf. Ihr ausgeprägter Anstieg entspricht der Umwandlung in Hydrogenphosphat-Ionen.
Die Ergebnisse wurden mit den von den Veranstaltern veröffentlichten offiziellen Ergebnissen abgeglichen.
IChO 2003 · Teori sorusu 7
Fosfat çözeltilerinin titrasyon eğrileri
\(\ce{H3PO4}\) ve/veya \(\ce{NaH2PO4}\) içeren çözeltiler, standart bir kuvvetli baz çözeltisiyle titre edilmektedir. Bu çözeltilerin içeriklerini şekilde gösterilen titrasyon eğrileriyle (titrant hacmine karşı \(pH\)) eşleştiriniz:
(\(\ce{H3PO4}\) için: \(pK_1 = 2.1,\ pK_2 = 7.2,\ pK_3 = 12.0\))
a) Örnek yalnızca \(\ce{H3PO4}\) içermektedir.
Eğri A ( ), Eğri B ( ), Eğri C ( ), Eğri D ( )
b) Örnek, her ikisini de \(\ce{H3PO4} : \ce{NaH2PO4} = 2 : 1\) mol oranında içermektedir.
Eğri A ( ), Eğri B ( ), Eğri C ( ), Eğri D ( )
c) Örnek, her ikisini de \(\ce{H3PO4} : \ce{NaH2PO4} = 1 : 1\) mol oranında içermektedir.
Eğri A ( ), Eğri B ( ), Eğri C ( ), Eğri D ( )
Soru metni resmi İngilizce metinden çevrilmiştir.
Cevaplar
- a) Eğri A.
- b) Eğri B.
- c) Eğri D.
Çözüm
Açıklama için gerekli kimyasal türler şunlardır:
| Adı | Formülü | SMILES |
|---|---|---|
| Fosforik asit | \(\ce{H3PO4}\) | O=P(O)(O)O |
| Sodyum dihidrojen fosfat | \(\ce{NaH2PO4}\) | [Na+].O=P([O-])(O)O |
| Dihidrojen fosfat iyonu | \(\ce{H2PO4^-}\) | O=P([O-])(O)O |
| Hidrojen fosfat iyonu | \(\ce{HPO4^2-}\) | O=P([O-])([O-])O |
| Hidroksit iyonu | \(\ce{OH^-}\) | [OH-] |
| Su | \(\ce{H2O}\) | O |
Başlangıçtaki fosforik asit ve sodyum dihidrojen fosfat miktarları sırasıyla \(a\) ve \(b\) mol olsun. Gözlenen iki eşdeğerlik noktası, ardışık olarak gerçekleşen
\[ \ce{H3PO4 + OH^- -> H2PO4^- + H2O} \]
ve
\[ \ce{H2PO4^- + OH^- -> HPO4^2- + H2O} \]
nötralleşmelerine karşılık gelir.
Birinci eşdeğerlik noktasına ulaşmak için \(a\) mol hidroksit gerekir. Bu noktada çözelti \(a+b\) mol dihidrojen fosfat içerdiğinden, ikinci eşdeğerlik noktasına ulaşmak için ilave \(a+b\) mol hidroksit gerekir.
Dolayısıyla, baz derişimi \(c_{\mathrm B}\), \(\mathrm{mol\,L^{-1}}\) cinsinden ve eşdeğerlik noktalarına kadar eklenen toplam hacimler \(V_1,V_2\), litre cinsinden ifade edildiğinde,
\[ c_{\mathrm B}V_1=a, \qquad c_{\mathrm B}V_2=2a+b. \]
Bunun sonucunda,
\[ \boxed{\frac{V_2}{V_1}=2+\frac{b}{a}} \qquad\text{ve}\qquad \boxed{a:b=V_1:(V_2-2V_1)}. \]
\(pK_i\) değerleri arasındaki büyük farklar, bu nötralleşme aşamalarının ayırt edilmesini sağlar. Birinci ve ikinci eşdeğerlik noktalarındaki yaklaşık pH değerleri sırasıyla
\[ \frac{pK_1+pK_2}{2}=4.65, \qquad \frac{pK_2+pK_3}{2}=9.6, \]
olup, gösterilen iki dik yükselişle uyumludur.
a) Yalnızca fosforik asit
Burada \(b=0\) olduğundan,
\[ V_2=2V_1. \]
A eğrisinin eşdeğerlik noktaları yaklaşık \(2\ \mathrm{cm^3}\) ve \(4\ \mathrm{cm^3}\) hacimlerindedir; dolayısıyla bu koşulu sağlar. A eğrisini işaretleyiniz.
b) \(\ce{H3PO4}:\ce{NaH2PO4}=2:1\) mol oranı
Burada \(b/a=1/2\) olduğundan,
\[ \frac{V_2}{V_1}=2+\frac12=2.5. \]
B eğrisinin eşdeğerlik noktaları yaklaşık \(2\ \mathrm{cm^3}\) ve \(5\ \mathrm{cm^3}\) hacimlerindedir. Eşdeğer biçimde,
\[ a:b = 2:(5-2\times2) = 2:1. \]
B eğrisini işaretleyiniz.
c) \(\ce{H3PO4}:\ce{NaH2PO4}=1:1\) mol oranı
Burada \(b/a=1\) olduğundan,
\[ \frac{V_2}{V_1}=3. \]
D eğrisinin eşdeğerlik noktaları yaklaşık \(2\ \mathrm{cm^3}\) ve \(6\ \mathrm{cm^3}\) hacimlerindedir. Dolayısıyla,
\[ a:b = 2:(6-2\times2) = 2:2 = 1:1. \]
D eğrisini işaretleyiniz.
Geriye kalan C eğrisi, yalnızca sodyum dihidrojen fosfat içeren çözeltiye karşılık gelir. Bu eğri, amfiprotik dihidrojen fosfatın pH değeri olan yaklaşık \(4.65\) civarında başlar ve başlangıçta fosforik asidin nötralleşmesine ait bir basamak içermez. Eğrideki belirgin yükseliş, hidrojen fosfata dönüşüme karşılık gelir.
Sonuçlar, düzenleyicilerin yayımladığı resmi sonuçlarla karşılaştırılarak kontrol edildi.
IChO 2003 · Problema teórico 7
Curvas de valoración de disoluciones de fosfato
Se valoran disoluciones que contienen \(\ce{H3PO4}\) y/o \(\ce{NaH2PO4}\) con una disolución patrón de una base fuerte. Relacione el contenido de estas disoluciones con las curvas de valoración (\(pH\) frente al volumen de valorante) que se muestran en la figura:
(Para \(\ce{H3PO4}\): \(pK_1 = 2.1,\ pK_2 = 7.2,\ pK_3 = 12.0\))
a) La muestra contiene únicamente \(\ce{H3PO4}\).
Curva A ( ), Curva B ( ), Curva C ( ), Curva D ( )
b) La muestra contiene ambos en una proporción molar \(\ce{H3PO4} : \ce{NaH2PO4} = 2 : 1\).
Curva A ( ), Curva B ( ), Curva C ( ), Curva D ( )
c) La muestra contiene ambos en una proporción molar \(\ce{H3PO4} : \ce{NaH2PO4} = 1 : 1\).
Curva A ( ), Curva B ( ), Curva C ( ), Curva D ( )
Enunciado traducido del texto oficial en inglés.
Respuestas
- a) Curva A.
- b) Curva B.
- c) Curva D.
Solución
Las especies químicas necesarias para la explicación son:
| Nombre | Fórmula | SMILES |
|---|---|---|
| Ácido fosfórico | \(\ce{H3PO4}\) | O=P(O)(O)O |
| Dihidrogenofosfato de sodio | \(\ce{NaH2PO4}\) | [Na+].O=P([O-])(O)O |
| Ion dihidrogenofosfato | \(\ce{H2PO4^-}\) | O=P([O-])(O)O |
| Ion hidrogenofosfato | \(\ce{HPO4^2-}\) | O=P([O-])([O-])O |
| Ion hidróxido | \(\ce{OH^-}\) | [OH-] |
| Agua | \(\ce{H2O}\) | O |
Sean \(a\) y \(b\) mol las cantidades iniciales de ácido fosfórico y dihidrogenofosfato de sodio, respectivamente. Los dos puntos de equivalencia observados corresponden a las neutralizaciones sucesivas
\[ \ce{H3PO4 + OH^- -> H2PO4^- + H2O} \]
y
\[ \ce{H2PO4^- + OH^- -> HPO4^2- + H2O}. \]
Para alcanzar el primer punto de equivalencia se requieren \(a\) mol de hidróxido. En ese punto, la disolución contiene \(a+b\) mol de dihidrogenofosfato, por lo que para alcanzar el segundo punto de equivalencia se requieren otros \(a+b\) mol de hidróxido.
Así, para una concentración de base \(c_{\mathrm B}\) en \(\mathrm{mol\,L^{-1}}\) y unos volúmenes acumulados en los puntos de equivalencia \(V_1,V_2\) en litros,
\[ c_{\mathrm B}V_1=a, \qquad c_{\mathrm B}V_2=2a+b. \]
Por consiguiente,
\[ \boxed{\frac{V_2}{V_1}=2+\frac{b}{a}} \qquad\text{y}\qquad \boxed{a:b=V_1:(V_2-2V_1)}. \]
Los valores de \(pK_i\), muy separados entre sí, permiten distinguir estas etapas de neutralización. Los valores aproximados de pH en el primer y el segundo punto de equivalencia son, respectivamente,
\[ \frac{pK_1+pK_2}{2}=4.65, \qquad \frac{pK_2+pK_3}{2}=9.6, \]
en concordancia con los dos ascensos pronunciados que se muestran.
a) Solo ácido fosfórico
En este caso, \(b=0\), lo que da
\[ V_2=2V_1. \]
La curva A tiene puntos de equivalencia aproximadamente en \(2\ \mathrm{cm^3}\) y \(4\ \mathrm{cm^3}\), por lo que satisface esta condición. Marque la curva A.
b) Proporción molar \(\ce{H3PO4}:\ce{NaH2PO4}=2:1\)
En este caso, \(b/a=1/2\), por lo que
\[ \frac{V_2}{V_1}=2+\frac12=2.5. \]
La curva B tiene puntos de equivalencia aproximadamente en \(2\ \mathrm{cm^3}\) y \(5\ \mathrm{cm^3}\). De forma equivalente,
\[ a:b = 2:(5-2\times2) = 2:1. \]
Marque la curva B.
c) Proporción molar \(\ce{H3PO4}:\ce{NaH2PO4}=1:1\)
En este caso, \(b/a=1\), por lo que
\[ \frac{V_2}{V_1}=3. \]
La curva D tiene puntos de equivalencia aproximadamente en \(2\ \mathrm{cm^3}\) y \(6\ \mathrm{cm^3}\). Por tanto,
\[ a:b = 2:(6-2\times2) = 2:2 = 1:1. \]
Marque la curva D.
La curva restante, C, corresponde únicamente al dihidrogenofosfato de sodio. Comienza cerca del pH del dihidrogenofosfato anfiprótico, aproximadamente \(4.65\), y no presenta una etapa inicial de neutralización del ácido fosfórico. Su ascenso destacado corresponde a la conversión en hidrogenofosfato.
Los resultados se comprobaron con los resultados oficiales publicados por los organizadores.
IChO 2003 · 理论题 7
磷酸盐溶液的滴定曲线
用强碱标准溶液滴定含有 \(\ce{H3PO4}\) 和/或 \(\ce{NaH2PO4}\) 的溶液。将这些溶液的组成与图中所示的滴定曲线(\(pH\) 随滴定剂体积的变化曲线)对应起来:
(对于 \(\ce{H3PO4}\):\(pK_1 = 2.1,\ pK_2 = 7.2,\ pK_3 = 12.0\))
a) 试样仅含 \(\ce{H3PO4}\)。
曲线 A ( ), 曲线 B ( ), 曲线 C ( ), 曲线 D ( )
b) 试样含有这两种物质,其物质的量之比为 \(\ce{H3PO4} : \ce{NaH2PO4} = 2 : 1\)。
曲线 A ( ), 曲线 B ( ), 曲线 C ( ), 曲线 D ( )
c) 试样含有这两种物质,其物质的量之比为 \(\ce{H3PO4} : \ce{NaH2PO4} = 1 : 1\)。
曲线 A ( ), 曲线 B ( ), 曲线 C ( ), 曲线 D ( )
题目译自官方英文原文。
答案
- a) 曲线 A。
- b) 曲线 B。
- c) 曲线 D。
解答
解释中所需的化学物种如下:
| 名称 | 化学式 | SMILES |
|---|---|---|
| 磷酸 | \(\ce{H3PO4}\) | O=P(O)(O)O |
| 磷酸二氢钠 | \(\ce{NaH2PO4}\) | [Na+].O=P([O-])(O)O |
| 磷酸二氢根离子 | \(\ce{H2PO4^-}\) | O=P([O-])(O)O |
| 磷酸氢根离子 | \(\ce{HPO4^2-}\) | O=P([O-])([O-])O |
| 氢氧根离子 | \(\ce{OH^-}\) | [OH-] |
| 水 | \(\ce{H2O}\) | O |
设磷酸和磷酸二氢钠的初始物质的量分别为 \(a\) 和 \(b\) mol。观察到的两个等当点对应于依次发生的中和反应
\[ \ce{H3PO4 + OH^- -> H2PO4^- + H2O} \]
和
\[ \ce{H2PO4^- + OH^- -> HPO4^2- + H2O}. \]
达到第一等当点需要 \(a\) mol 的氢氧根离子。此时,溶液含有 \(a+b\) mol 的磷酸二氢根离子,因此达到第二等当点还需要 \(a+b\) mol 的氢氧根离子。
因此,若碱的浓度为 \(c_{\mathrm B}\),单位为 \(\mathrm{mol\,L^{-1}}\),达到各等当点时所加入的碱的累计体积为 \(V_1,V_2\),单位为升,则
\[ c_{\mathrm B}V_1=a, \qquad c_{\mathrm B}V_2=2a+b. \]
由此可得,
\[ \boxed{\frac{V_2}{V_1}=2+\frac{b}{a}} \qquad\text{且}\qquad \boxed{a:b=V_1:(V_2-2V_1)}. \]
各 \(pK_i\) 值相差很大,使这些中和阶段能够被区分。第一和第二等当点处的近似 pH 值分别为
\[ \frac{pK_1+pK_2}{2}=4.65, \qquad \frac{pK_2+pK_3}{2}=9.6, \]
这与图中所示的两处陡升相符。
a) 仅含磷酸
此时 \(b=0\),因此
\[ V_2=2V_1. \]
曲线 A 的等当点分别位于约 \(2\ \mathrm{cm^3}\) 和 \(4\ \mathrm{cm^3}\) 处,因此满足这一条件。勾选曲线 A。
b) 物质的量之比为 \(\ce{H3PO4}:\ce{NaH2PO4}=2:1\)
此时 \(b/a=1/2\),所以
\[ \frac{V_2}{V_1}=2+\frac12=2.5. \]
曲线 B 的等当点分别位于约 \(2\ \mathrm{cm^3}\) 和 \(5\ \mathrm{cm^3}\) 处。等价地,
\[ a:b = 2:(5-2\times2) = 2:1. \]
勾选曲线 B。
c) 物质的量之比为 \(\ce{H3PO4}:\ce{NaH2PO4}=1:1\)
此时 \(b/a=1\),所以
\[ \frac{V_2}{V_1}=3. \]
曲线 D 的等当点分别位于约 \(2\ \mathrm{cm^3}\) 和 \(6\ \mathrm{cm^3}\) 处。因此,
\[ a:b = 2:(6-2\times2) = 2:2 = 1:1. \]
勾选曲线 D。
剩下的曲线 C 对应于仅含磷酸二氢钠的溶液。其起始 pH 接近两性物种磷酸二氢根离子溶液的 pH,约为 \(4.65\),且没有初始的磷酸中和阶段。其明显的陡升对应于磷酸二氢根离子转化为磷酸氢根离子的过程。
结果已与主办方公布的官方答案核对。
IChO 2003 · Теоретическая задача 7
Кривые титрования фосфатных растворов
Растворы, содержащие \(\ce{H3PO4}\) и/или \(\ce{NaH2PO4}\), титруют стандартным раствором сильного основания. Установите соответствие между составом этих растворов и кривыми титрования (зависимость \(pH\) от объёма титранта), приведёнными на рисунке:
(Для \(\ce{H3PO4}\): \(pK_1 = 2.1,\ pK_2 = 7.2,\ pK_3 = 12.0\))
a) Проба содержит только \(\ce{H3PO4}\).
Кривая A ( ), Кривая B ( ), Кривая C ( ), Кривая D ( )
b) Проба содержит оба вещества в мольном соотношении \(\ce{H3PO4} : \ce{NaH2PO4} = 2 : 1\).
Кривая A ( ), Кривая B ( ), Кривая C ( ), Кривая D ( )
c) Проба содержит оба вещества в мольном соотношении \(\ce{H3PO4} : \ce{NaH2PO4} = 1 : 1\).
Кривая A ( ), Кривая B ( ), Кривая C ( ), Кривая D ( )
Условие переведено с официального английского текста.
Ответы
- a) Кривая A.
- b) Кривая B.
- c) Кривая D.
Решение
Химические частицы, необходимые для объяснения:
| Название | Формула | SMILES |
|---|---|---|
| Ортофосфорная кислота | \(\ce{H3PO4}\) | O=P(O)(O)O |
| Дигидрофосфат натрия | \(\ce{NaH2PO4}\) | [Na+].O=P([O-])(O)O |
| Дигидрофосфат-ион | \(\ce{H2PO4^-}\) | O=P([O-])(O)O |
| Гидрофосфат-ион | \(\ce{HPO4^2-}\) | O=P([O-])([O-])O |
| Гидроксид-ион | \(\ce{OH^-}\) | [OH-] |
| Вода | \(\ce{H2O}\) | O |
Пусть исходные количества ортофосфорной кислоты и дигидрофосфата натрия равны соответственно \(a\) и \(b\) моль. Две наблюдаемые точки эквивалентности соответствуют последовательным реакциям нейтрализации
\[ \ce{H3PO4 + OH^- -> H2PO4^- + H2O} \]
и
\[ \ce{H2PO4^- + OH^- -> HPO4^2- + H2O}. \]
Для достижения первой точки эквивалентности требуется \(a\) моль гидроксид-ионов. В этой точке раствор содержит \(a+b\) моль дигидрофосфат-ионов, поэтому для достижения второй точки эквивалентности требуется ещё \(a+b\) моль гидроксид-ионов.
Таким образом, при концентрации основания \(c_{\mathrm B}\), выраженной в \(\mathrm{mol\,L^{-1}}\), и суммарных объёмах титранта до точек эквивалентности \(V_1,V_2\), выраженных в литрах,
\[ c_{\mathrm B}V_1=a, \qquad c_{\mathrm B}V_2=2a+b. \]
Следовательно,
\[ \boxed{\frac{V_2}{V_1}=2+\frac{b}{a}} \qquad\text{и}\qquad \boxed{a:b=V_1:(V_2-2V_1)}. \]
Значительные различия между значениями \(pK_i\) позволяют различить эти стадии нейтрализации. Приближённые значения pH в первой и второй точках эквивалентности соответственно равны
\[ \frac{pK_1+pK_2}{2}=4.65, \qquad \frac{pK_2+pK_3}{2}=9.6, \]
что согласуется с двумя показанными на рисунке резкими подъёмами.
a) Только ортофосфорная кислота
Здесь \(b=0\), откуда
\[ V_2=2V_1. \]
У кривой A точки эквивалентности находятся приблизительно при \(2\ \mathrm{cm^3}\) и \(4\ \mathrm{cm^3}\), поэтому она удовлетворяет этому условию. Отметьте кривую A.
b) Мольное соотношение \(\ce{H3PO4}:\ce{NaH2PO4}=2:1\)
Здесь \(b/a=1/2\), поэтому
\[ \frac{V_2}{V_1}=2+\frac12=2.5. \]
У кривой B точки эквивалентности находятся приблизительно при \(2\ \mathrm{cm^3}\) и \(5\ \mathrm{cm^3}\). Эквивалентная запись:
\[ a:b = 2:(5-2\times2) = 2:1. \]
Отметьте кривую B.
c) Мольное соотношение \(\ce{H3PO4}:\ce{NaH2PO4}=1:1\)
Здесь \(b/a=1\), поэтому
\[ \frac{V_2}{V_1}=3. \]
У кривой D точки эквивалентности находятся приблизительно при \(2\ \mathrm{cm^3}\) и \(6\ \mathrm{cm^3}\). Следовательно,
\[ a:b = 2:(6-2\times2) = 2:2 = 1:1. \]
Отметьте кривую D.
Оставшаяся кривая, C, соответствует раствору, содержащему только дигидрофосфат натрия. Она начинается вблизи значения pH раствора амфипротного дигидрофосфат-иона, приблизительно \(4.65\), и на ней отсутствует начальная стадия нейтрализации ортофосфорной кислоты. Её выраженный подъём соответствует превращению дигидрофосфат-иона в гидрофосфат-ион.
Ответы проверены по официальным ответам, опубликованным организаторами.
IChO 2003 · مسألة نظرية 7
منحنيات معايرة محاليل الفوسفات
تُعايَر محاليل تحتوي على \(\ce{H3PO4}\) و/أو \(\ce{NaH2PO4}\) بمحلول قياسي لقاعدة قوية. اربط محتويات هذه المحاليل بمنحنيات المعايرة (\(pH\) بدلالة حجم محلول المعايرة) المبينة في الشكل:
(بالنسبة إلى \(\ce{H3PO4}\): \(pK_1 = 2.1,\ pK_2 = 7.2,\ pK_3 = 12.0\))
a) تحتوي العينة على \(\ce{H3PO4}\) فقط.
المنحنى A ( ), المنحنى B ( ), المنحنى C ( ), المنحنى D ( )
b) تحتوي العينة على كليهما بنسبة مولية \(\ce{H3PO4} : \ce{NaH2PO4} = 2 : 1\).
المنحنى A ( ), المنحنى B ( ), المنحنى C ( ), المنحنى D ( )
c) تحتوي العينة على كليهما بنسبة مولية \(\ce{H3PO4} : \ce{NaH2PO4} = 1 : 1\).
المنحنى A ( ), المنحنى B ( ), المنحنى C ( ), المنحنى D ( )
نص المسألة مترجم عن النص الإنجليزي الرسمي.
الإجابات
- a) المنحنى A.
- b) المنحنى B.
- c) المنحنى D.
الحل
الأنواع الكيميائية اللازمة للشرح هي:
| الاسم | الصيغة | SMILES |
|---|---|---|
| حمض الفوسفوريك | \(\ce{H3PO4}\) | O=P(O)(O)O |
| فوسفات ثنائي هيدروجين الصوديوم | \(\ce{NaH2PO4}\) | [Na+].O=P([O-])(O)O |
| أيون فوسفات ثنائي الهيدروجين | \(\ce{H2PO4^-}\) | O=P([O-])(O)O |
| أيون فوسفات الهيدروجين | \(\ce{HPO4^2-}\) | O=P([O-])([O-])O |
| أيون الهيدروكسيد | \(\ce{OH^-}\) | [OH-] |
| الماء | \(\ce{H2O}\) | O |
لتكن كميتا المادة الابتدائيتان لحمض الفوسفوريك وفوسفات ثنائي هيدروجين الصوديوم \(a\) و\(b\) مول، على الترتيب. تقابل نقطتا التكافؤ المرصودتان تفاعلي التعادل المتتاليين
\[ \ce{H3PO4 + OH^- -> H2PO4^- + H2O} \]
و
\[ \ce{H2PO4^- + OH^- -> HPO4^2- + H2O}. \]
يتطلب الوصول إلى نقطة التكافؤ الأولى \(a\) مول من الهيدروكسيد. وعند تلك النقطة، يحتوي المحلول على \(a+b\) مول من فوسفات ثنائي الهيدروجين، لذا يتطلب الوصول إلى نقطة التكافؤ الثانية إضافة \(a+b\) مول أخرى من الهيدروكسيد.
وبالتالي، إذا كان تركيز القاعدة \(c_{\mathrm B}\) بوحدة \(\mathrm{mol\,L^{-1}}\)، وكان الحجمان التراكميان عند نقطتي التكافؤ \(V_1,V_2\) باللتر، فإن
\[ c_{\mathrm B}V_1=a, \qquad c_{\mathrm B}V_2=2a+b. \]
وعليه،
\[ \boxed{\frac{V_2}{V_1}=2+\frac{b}{a}} \qquad\text{و}\qquad \boxed{a:b=V_1:(V_2-2V_1)}. \]
يسمح التباعد الكبير بين قيم \(pK_i\) بتمييز مراحل التعادل هذه. وتبلغ القيم التقريبية للأس الهيدروجيني عند نقطتي التكافؤ الأولى والثانية، على الترتيب،
\[ \frac{pK_1+pK_2}{2}=4.65, \qquad \frac{pK_2+pK_3}{2}=9.6, \]
وهو ما يتفق مع الارتفاعين الحادين المبينين.
a) حمض الفوسفوريك فقط
هنا \(b=0\)، مما يعطي
\[ V_2=2V_1. \]
للمنحنى A نقطتا تكافؤ عند نحو \(2\ \mathrm{cm^3}\) و\(4\ \mathrm{cm^3}\)، لذا فهو يحقق هذا الشرط. ضع علامة عند المنحنى A.
b) النسبة المولية \(\ce{H3PO4}:\ce{NaH2PO4}=2:1\)
هنا \(b/a=1/2\)، لذا
\[ \frac{V_2}{V_1}=2+\frac12=2.5. \]
للمنحنى B نقطتا تكافؤ عند نحو \(2\ \mathrm{cm^3}\) و\(5\ \mathrm{cm^3}\). وبصورة مكافئة،
\[ a:b = 2:(5-2\times2) = 2:1. \]
ضع علامة عند المنحنى B.
c) النسبة المولية \(\ce{H3PO4}:\ce{NaH2PO4}=1:1\)
هنا \(b/a=1\)، لذا
\[ \frac{V_2}{V_1}=3. \]
للمنحنى D نقطتا تكافؤ عند نحو \(2\ \mathrm{cm^3}\) و\(6\ \mathrm{cm^3}\). ومن ثم،
\[ a:b = 2:(6-2\times2) = 2:2 = 1:1. \]
ضع علامة عند المنحنى D.
يقابل المنحنى المتبقي، C، فوسفات ثنائي هيدروجين الصوديوم وحده. ويبدأ بالقرب من قيمة الأس الهيدروجيني لفوسفات ثنائي الهيدروجين، القادر على منح البروتون واستقباله، وهي نحو \(4.65\)، ولا توجد فيه مرحلة ابتدائية لتعادل حمض الفوسفوريك. ويقابل ارتفاعه البارز التحول إلى فوسفات الهيدروجين.
تمت مراجعة النتائج بمقارنتها بالنتائج الرسمية التي نشرها المنظمون.