IChO 2020 · Theory problem 9
Quantification of Heavy Metal Ions
| 12% of the total | Points | 5 | 5 | 8 | 16 | 5 | 6 | 25 | 30 | 100 |
Problem 9. Quantification of Heavy Metal Ions
For the quantitative analysis of heavy metal ions in a factory’s wastewater pool, the following steps have been applied by an analyzer at 298 K:
Step 1) 10-mL samples of each were obtained from five different regions in a wastewater pool, mixed in a 100-mL beaker, and then stirred for 5 minutes using a magnetic stirrer.
Step 2) 10-mL of sample solution was taken from the 100-mL beaker and 142 mg of \(\ce{Na2SO4}\) was added while stirring, followed by transfer to a three-electrode cell as seen in Figure 1a. In this electrochemical cell, \(\ce{Pt}\) wire, \(\ce{Ag/AgCl}\) (3 M \(\ce{KCl}\)), and \(\ce{Pt}\) foil served as the working, reference, and counter electrodes, respectively.
Step 3) These electrodes were connected to a potentiostat and a constant potential of −0.50 V vs. \(\ce{Ag/AgCl}\) for 14 minutes was applied as seen in Figure 1b (horizontal line). It is assumed that 14 min. is sufficient to complete the expected electrochemical reactions.
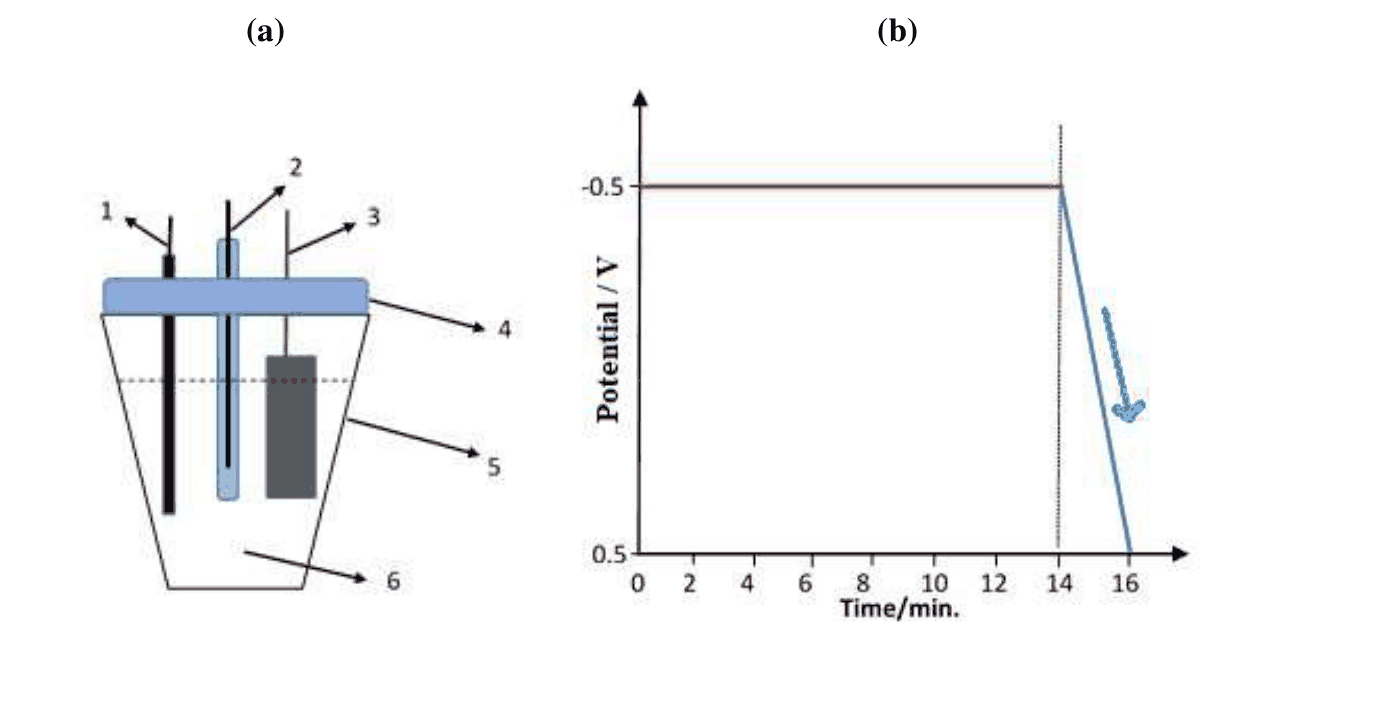
Figure 1. a) Electrochemical cell design; 1) Working electrode (\(\ce{Pt}\) wire), 2) reference electrode (\(\ce{Ag/AgCl}\), 3M \(\ce{KCl}\)), 3) counter electrode (\(\ce{Pt}\) foil), 4) cell tap, 5) electrochemical cell, 6) 10-mL of sample solution. b) Potential change of working electrode as a function of time. y-axis: potential/V vs \(\ce{Ag/AgCl}\), x-axis: time/min.
Step 4) The electrodes were rinsed with distilled water, placed into another electrochemical cell including 10-mL of 0.1 M \(\ce{H2SO4}\) solution, and potential was scanned between −0.50 and +0.50 V as seen in Figure 1b (downward sloping line in 2 min.). Current vs. potential data for this step are presented in Figure 2a, which is like an excellent view of Mount Ararat (Ağrı Dağı), the highest mountain in Turkey (Figure 2b).
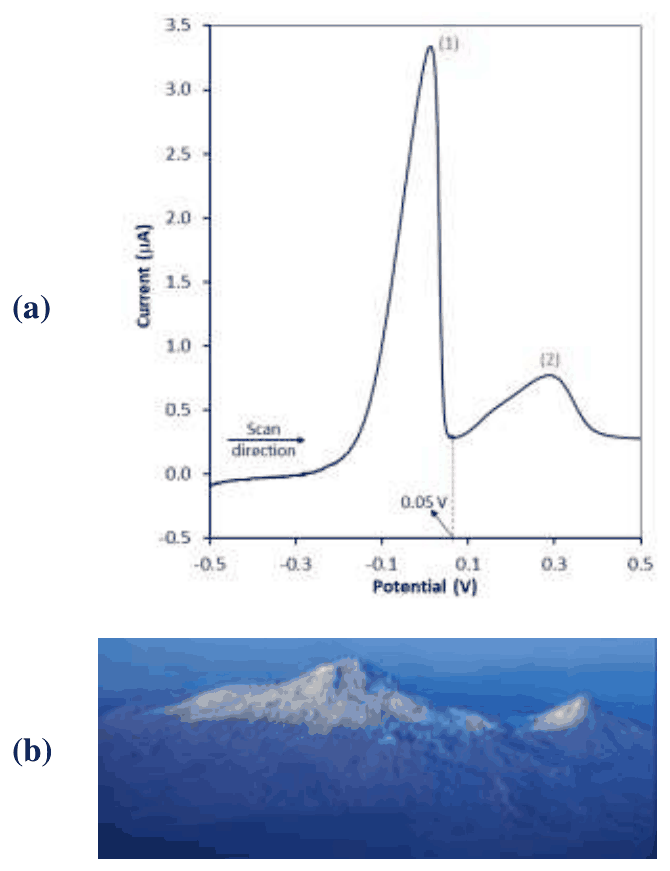
Figure 2. a) Potential scan of the working electrode as a function of current in 0.1 M \(\ce{H2SO4}\) solution after keeping it constant at a potential of −0.50 V in 10-mL of wastewater sample as seen in Figure 1b (horizontal line). y-axis: current/μA, x-axis: potential/V vs \(\ce{Ag/AgCl}\), b) A view of Great and Little Ararat peaks.
Step 5) Another 10-mL of the sample solution prepared in step 1 was taken and the processes explained in steps 2 and 3 were applied in that order. The electrodes were rinsed with distilled water and placed into 10-mL of 0.1 M \(\ce{H2SO4}\) solution. Then the potential of the working electrode was kept constant at +0.05 V for 14 minutes. It is assumed that 14 min. is sufficient to complete the expected electrochemical reactions.
Step 6) After step 5 was performed, the solution in the electrochemical cell was placed in a suitable oven to evaporate at 150 °C until dry solid was obtained.
Step 7) 5-mL of ethylenediaminetetraacetic acid (EDTA, \(\ce{H4Y}\)) (Figure 3) solution was added to the solid obtained in step 6 and it was shaken to dissolve. It is known that 1-mL of EDTA solution is equivalent to 3.85 mg/mL \(\ce{BaCO3}\). Then, pH of the solution was adjusted to 10.0. Excess EDTA was titrated with standard 0.0010 M \(\ce{Ni(NO3)2}\) solution and it was observed that 95.60 mL of \(\ce{Ni(NO3)2}\) solution was consumed up to the endpoint.
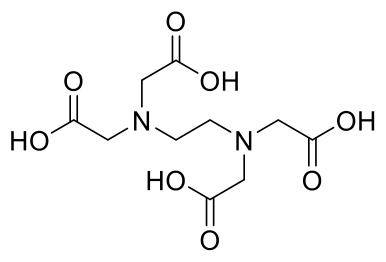
Figure 3. Chemical structure of EDTA (\(\ce{H4Y}\)).
- In water saturated with \(\ce{H2S}\), equilibrium concentration of \([\ce{H2S}]\) is 0.1 M.
- \(K_{\mathrm{sp}}(\ce{NiS})=4.0\times10^{-20}\); \(K_{\mathrm{sp}}(\ce{CuS})=1.0\times10^{-36}\)
- \(K_{\mathrm{a1}}(\ce{H2S})=9.6\times10^{-8}\); \(K_{\mathrm{a2}}(\ce{H2S})=1.3\times10^{-14}\)
| Reaction | \(E^\circ/\mathrm{V}\) (at 298 K) |
|---|---|
| \(\ce{2H2O(l) + 2e- -> H2(g) + 2OH-(aq)}\) | −0.83 |
| \(\ce{Ni^2+(aq) + 2e- -> Ni(s)}\) | −0.24 |
| \(\ce{2H+(aq) + 2e- -> H2(g)}\) | 0.00 |
| \(\ce{Cu^2+(aq) + 2e- -> Cu(s)}\) | +0.34 |
| \(\ce{Ag+(aq) + e- -> Ag(s)}\) | +0.80 |
| \(\ce{O2(g) + 4H+(aq) + 4e- -> 2H2O(l)}\) | +1.23 |
9.1. Which of the following can be considered for peak 1 and peak 2 in Figure 2a, respectively? Tick the correct box on the answer sheet.
- ☐ Peak 1: electrochemical reduction of \(\ce{Ni}\) / Peak 2: electrochemical reduction of \(\ce{Cu}\)
- ☐ Peak 1: electrochemical reduction of \(\ce{Cu}\) / Peak 2: electrochemical reduction of \(\ce{Ni}\)
- ☐ Peak 1: electrochemical reduction of \(\ce{Ni}\) / Peak 2: electrochemical oxidation of \(\ce{Cu}\)
- ☐ Peak 1: electrochemical oxidation of \(\ce{Ni}\) / Peak 2: electrochemical oxidation of \(\ce{Cu}\)
- ☐ Peak 1: electrochemical oxidation of \(\ce{Cu}\) / Peak 2: electrochemical oxidation of \(\ce{Ni}\)
9.2. Which of the statement is expected, if the potential is applied as −1.2 V instead of -0.5 V at the first step (horizontal line) in Figure 1b? Tick the correct box on the answer sheet.
- ☐ \(\ce{NO}\) evolution
- ☐ \(\ce{NO2}\) evolution
- ☐ Nitrogen evolution
- ☐ Oxygen evolution
- ☐ Hydrogen evolution
9.3. Calculate the scan rate of data presented in Figure 2a as mV/s at 298 K.
The potential of the following cell is measured as 0.437 V.
\[ \ce{Pt},\ce{H2}(0.92\ \mathrm{bar}) \mid \ce{HCl}(1.50\times10^{-2}\ \mathrm{M}),\ce{AgCl}(sat) \mid\ce{Ag} \]
9.4. Calculate the standard electrode potential value (V) of half-cell of \(\ce{AgCl(s) + e- -> Ag(s) + Cl-(aq)}\) at 298 K. Note: You must show all works.
9.5. Which of the statements is the main purpose of step 5 in this analysis? Tick the correct box on the answer sheet.
- ☐ Modification of \(\ce{Pt}\) wire with \(\ce{Ni}\)–\(\ce{Cu}\) alloy film
- ☐ Modification of \(\ce{Pt}\) wire with \(\ce{Ni}\) film
- ☐ Electrochemical stripping of both \(\ce{Cu}\) and \(\ce{Ni}\) from \(\ce{Cu}\)–\(\ce{Ni}\)-modified \(\ce{Pt}\) wire to the solution
- ☐ Electrochemical stripping of \(\ce{Cu}\) from \(\ce{Cu}\)–\(\ce{Ni}\)-modified \(\ce{Pt}\) wire to the solution
- ☐ Electrochemical stripping of \(\ce{Ni}\) from \(\ce{Cu}\)–\(\ce{Ni}\)-modified \(\ce{Pt}\) wire to the solution
9.6. Write net ionic equations for the complexation and the back titration reaction of step 7 on the answer sheet
9.7. Calculate \(\ce{Ni^2+}\) concentration as mg/L in the wastewater of the factory. Note: You must show all works.
9.8. Calculate the minimum pH value for starting the precipitation of \(\ce{Ni^2+}\) ions in the solution obtained in step 5 by passing \(\ce{H2S}\) gas into the solution until saturation. If you cannot solve question 9.7, use 20 mg/L \(\ce{Ni^2+}\) sample for this question. Note: You must show all works.
Official English text of the problem.
Answers
- 9.1. Fourth box: peak 1 is nickel oxidation; peak 2 is copper oxidation.
- 9.2. Fifth box: hydrogen evolution, \(\ce{H2}\), SMILES
[H][H]. - 9.3. \(\boxed{v=+8.33\ \mathrm{mV\,s^{-1}}}\).
- 9.4. \(\boxed{E^\circ_{\ce{AgCl/Ag}}=+0.222\ \mathrm{V}}\), relative to the standard hydrogen electrode.
- 9.5. Fifth box: selective electrochemical stripping of nickel from the copper–nickel deposit into solution.
- 9.6. Complexation: \(\ce{Ni^2+ + H4Y -> [NiY]^2- + 4H+}\). Back titration, using fully deprotonated EDTA notation: \(\ce{Ni^2+ + Y^4- -> [NiY]^2-}\). Species names and SMILES are given below.
- 9.7. \(\boxed{c_{\mathrm{mass}}(\ce{Ni^2+})\approx11.4\ \mathrm{mg\,L^{-1}}}\), or approximately \(11\ \mathrm{mg\,L^{-1}}\) to two significant figures.
- 9.8. \(\boxed{\mathrm{pH}_{\min}\approx3.11}\).
Solution
9.1. Identification of the stripping peaks
During the deposition step, nickel(II) ions, \(\ce{Ni^2+}\), SMILES [Ni+2], and copper(II) ions, \(\ce{Cu^2+}\), SMILES [Cu+2], are reduced onto the working electrode:
\[ \ce{Ni^2+(aq) + 2e- -> Ni(s)} \] \[ \ce{Cu^2+(aq) + 2e- -> Cu(s)} \]
The subsequent scan goes from −0.50 to +0.50 V: it moves toward more positive potential, despite the downward appearance of the line in Figure 1b. The deposited metals are therefore oxidized and stripped into solution.
Nickel has the lower standard reduction potential:
\[ E^\circ_{\ce{Ni^2+/Ni}}=-0.24\ \mathrm{V} < E^\circ_{\ce{Cu^2+/Cu}}=+0.34\ \mathrm{V}. \]
Nickel is consequently oxidized at the earlier, less positive stripping peak, followed by copper:
\[ \text{Peak 1:}\qquad \ce{Ni(s) -> Ni^2+(aq) + 2e-} \] \[ \text{Peak 2:}\qquad \ce{Cu(s) -> Cu^2+(aq) + 2e-}. \]
Thus, tick the fourth box.
9.2. Effect of applying −1.2 V
The much more negative working-electrode potential promotes reduction of water and hydrogen evolution:
\[ \ce{2H2O(l) + 2e- -> H2(g) + 2OH-(aq)}. \]
The species are water, SMILES O; hydrogen, SMILES [H][H]; and hydroxide ion, SMILES [OH-].
Thus, tick the fifth box: hydrogen evolution.
9.3. Scan rate
The potential changes by \(1.00\ \mathrm{V}\) in \(2\ \mathrm{min}=120\ \mathrm{s}\):
\[ v=\frac{\Delta E}{\Delta t} =\frac{(+0.50)-(-0.50)}{120} =8.333\times10^{-3}\ \mathrm{V\,s^{-1}}. \]
Therefore,
\[ \boxed{v=+8.33\ \mathrm{mV\,s^{-1}}}. \]
The positive sign indicates increasing potential.
9.4. Standard potential of the silver/silver chloride electrode
Hydrochloric acid supplies hydrogen ions, \(\ce{H+}\), SMILES [H+], and chloride ions, \(\ce{Cl-}\), SMILES [Cl-]. Silver(I) chloride has the ionic-component SMILES [Ag+].[Cl-]; this specifies its constituents, not its crystal lattice.
The left-hand electrode undergoes oxidation:
\[ \ce{H2(g) -> 2H+(aq) + 2e-}. \]
The right-hand electrode undergoes reduction:
\[ \ce{2AgCl(s) + 2e- -> 2Ag(s) + 2Cl-(aq)}. \]
The overall cell reaction is therefore
\[ \ce{H2(g) + 2AgCl(s) -> 2H+(aq) + 2Ag(s) + 2Cl-(aq)}. \]
Two electrons are transferred, and the reaction quotient is
\[ Q=\frac{a_{\ce{H+}}^2a_{\ce{Cl-}}^2} {p_{\ce{H2}}/p^\circ}. \]
Taking solution activities as concentrations divided by the standard concentration, and neglecting the small chloride contribution from dissolved silver chloride,
\[ a_{\ce{H+}}=a_{\ce{Cl-}}=1.50\times10^{-2}, \qquad \frac{p_{\ce{H2}}}{p^\circ}=0.92. \]
Thus,
\[ Q=\frac{(1.50\times10^{-2})^4}{0.92} =5.5027\times10^{-8}. \]
Since the standard hydrogen electrode has \(E^\circ=0\),
\[ E^\circ_{\mathrm{cell}}=E^\circ_{\ce{AgCl/Ag}}. \]
The Nernst equation gives
\[ E_{\mathrm{cell}} =E^\circ_{\mathrm{cell}}-\frac{RT}{2F}\ln Q, \]
so, using \(R=8.314\ \mathrm{J\,mol^{-1}\,K^{-1}}\) and \(F=96485\ \mathrm{C\,mol^{-1}}\),
\[ \begin{aligned} E^\circ_{\ce{AgCl/Ag}} &=0.437+ \frac{(8.314)(298)}{2(96485)} \ln(5.5027\times10^{-8})\\ &=0.437-0.2146\\ &=0.2224\ \mathrm{V}. \end{aligned} \]
Therefore,
\[ \boxed{E^\circ_{\ce{AgCl/Ag}}=+0.222\ \mathrm{V}\text{ vs SHE}}. \]
9.5. Purpose of step 5
In Figure 2a, +0.05 V lies after the nickel stripping peak and before the copper stripping peak. Holding the electrode at this potential selectively oxidizes deposited nickel:
\[ \ce{Ni(s) -> Ni^2+(aq) + 2e-}. \]
Under the problem’s stated assumption of complete reaction, nickel is transferred into the fresh acid solution while copper remains on the electrode. This separates nickel for its subsequent determination.
Thus, tick the fifth box.
9.6. Complexation and back-titration equations
The ligand and complex are:
- Ethylenediaminetetraacetic acid, \(\ce{H4Y}\):
O=C(O)CN(CC(=O)O)CCN(CC(=O)O)CC(=O)O - Ethylenediaminetetraacetate ion, \(\ce{Y^4-}\):
O=C([O-])CN(CC(=O)[O-])CCN(CC(=O)[O-])CC(=O)[O-] - Nickel(II)–EDTA complex, \(\ce{[NiY]^2-}\), using dative-bond SMILES:
[Ni+2]12345<-N(CC(=O)[O-]->1)(CC(=O)[O-]->2)CCN->3(CC(=O)[O-]->4)CC(=O)[O-]->5
EDTA coordinates through its two amine nitrogen atoms and one oxygen atom from each of its four carboxylate groups. This gives an approximately octahedral nickel coordination environment. The SMILES specifies donor connectivity; no particular coordination stereoisomer or conformation is selected.
For complexation of the sample nickel, written with the acid specified in the problem,
\[ \boxed{\ce{Ni^2+(aq) + H4Y(aq) -> [NiY]^2-(aq) + 4H+(aq)}}. \]
For back titration of the excess EDTA, written using the fully deprotonated ligand,
\[ \boxed{\ce{Ni^2+(aq) + Y^4-(aq) -> [NiY]^2-(aq)}}. \]
These are alternative protonation conventions for the same underlying complex formation. The second equation does not require all uncomplexed EDTA to exist as \(\ce{Y^4-}\) at pH 10; protonation equilibria accompany complexation.
Crucially, one mole of nickel(II) consumes one mole of EDTA in both stages.
9.7. Nickel concentration in the wastewater
Interpret the EDTA standardization as \(3.85\ \mathrm{mg}\) of barium carbonate equivalent per millilitre of EDTA solution.
Barium carbonate, \(\ce{BaCO3}\), has ionic-component SMILES [Ba+2].[O-]C(=O)[O-]. Each mole contains one mole of barium(II) ion, [Ba+2], corresponding to one mole of EDTA in a 1:1 metal–EDTA complex.
Using
\[ M(\ce{BaCO3})=197.34\ \mathrm{g\,mol^{-1}}, \qquad M(\ce{Ni})=58.69\ \mathrm{g\,mol^{-1}}, \]
the EDTA concentration is
\[ c_{\mathrm{EDTA}} = \frac{3.85\times10^{-3}\ \mathrm{g}/ (197.34\ \mathrm{g\,mol^{-1}})} {1.00\times10^{-3}\ \mathrm{L}} = 0.0195095\ \mathrm{mol\,L^{-1}}. \]
The amount added in \(5\ \mathrm{mL}\) is
\[ n_{\mathrm{EDTA,added}} =(0.005\ \mathrm{L})(0.0195095\ \mathrm{mol\,L^{-1}}) =9.75474\times10^{-5}\ \mathrm{mol}. \]
The back titration measures the unconsumed EDTA:
\[ \begin{aligned} n_{\mathrm{EDTA,excess}} &=n_{\mathrm{Ni,titrant}}\\ &=(0.09560\ \mathrm{L})(0.0010\ \mathrm{mol\,L^{-1}})\\ &=9.560\times10^{-5}\ \mathrm{mol}. \end{aligned} \]
Keeping guard digits in the subtraction, the nickel recovered from the wastewater aliquot is
\[ \begin{aligned} n_{\mathrm{Ni,sample}} &=n_{\mathrm{EDTA,added}}-n_{\mathrm{EDTA,excess}}\\ &=9.75474\times10^{-5}-9.560\times10^{-5}\\ &=1.9474\times10^{-6}\ \mathrm{mol}. \end{aligned} \]
This nickel came from \(10\ \mathrm{mL}=0.010\ \mathrm{L}\) of wastewater. Hence,
\[ \begin{aligned} c_{\mathrm{mass}}(\ce{Ni^2+}) &=\frac{(1.9474\times10^{-6}\ \mathrm{mol}) (58.69\ \mathrm{g\,mol^{-1}}) (10^3\ \mathrm{mg\,g^{-1}})} {0.010\ \mathrm{L}}\\ &=11.429\ \mathrm{mg\,L^{-1}}. \end{aligned} \]
Thus the nominal calculated result is
\[ \boxed{c_{\mathrm{mass}}(\ce{Ni^2+})\approx11.4\ \mathrm{mg\,L^{-1}}}, \]
or approximately \(11\ \mathrm{mg\,L^{-1}}\) to two significant figures.
The 100-mL beaker does not introduce a dilution factor: five 10-mL portions were mixed, with no instruction to dilute them to 100 mL. The result represents the pooled wastewater sample.
9.8. Minimum pH for nickel sulfide precipitation
The nickel recovered in step 5 is contained in \(10\ \mathrm{mL}\), so its concentration before precipitation is
\[ [\ce{Ni^2+}] =\frac{1.9474\times10^{-6}\ \mathrm{mol}}{0.010\ \mathrm{L}} =1.9474\times10^{-4}\ \mathrm{mol\,L^{-1}}. \]
The sulfur species are hydrogen sulfide, \(\ce{H2S}\), SMILES S; hydrosulfide ion, \(\ce{HS-}\), SMILES [SH-]; and sulfide ion, \(\ce{S^2-}\), SMILES [S-2].
Their acid-dissociation equilibria are
\[ \ce{H2S(aq) <=> H+(aq) + HS-(aq)} \]
and
\[ \ce{HS-(aq) <=> H+(aq) + S^2-(aq)}. \]
Multiplying the two equilibrium expressions gives
\[ K_{\mathrm{a1}}K_{\mathrm{a2}} = \frac{[\ce{H+}]^2[\ce{S^2-}]}{[\ce{H2S}]}. \]
Therefore,
\[ [\ce{S^2-}] = \frac{K_{\mathrm{a1}}K_{\mathrm{a2}}[\ce{H2S}]} {[\ce{H+}]^2}. \]
Nickel(II) sulfide, \(\ce{NiS}\), has ionic-component SMILES [Ni+2].[S-2]; its precipitation reaction is
\[ \ce{Ni^2+(aq) + S^2-(aq) -> NiS(s)}. \]
At the onset of precipitation,
\[ [\ce{Ni^2+}][\ce{S^2-}]=K_{\mathrm{sp}}. \]
Thus the required sulfide concentration is
\[ [\ce{S^2-}]_{\mathrm{crit}} = \frac{4.0\times10^{-20}}{1.9474\times10^{-4}} = 2.0540\times10^{-16}\ \mathrm{mol\,L^{-1}}. \]
Using the specified saturated concentration \([\ce{H2S}]=0.1\ \mathrm{M}\),
\[ \begin{aligned} [\ce{H+}] &= \sqrt{ \frac{K_{\mathrm{a1}}K_{\mathrm{a2}}[\ce{H2S}]} {[\ce{S^2-}]_{\mathrm{crit}}} }\\ &= \sqrt{ \frac{(9.6\times10^{-8})(1.3\times10^{-14})(0.1)} {2.0540\times10^{-16}} }\\ &=7.7948\times10^{-4}\ \mathrm{mol\,L^{-1}}. \end{aligned} \]
Consequently,
\[ \boxed{\mathrm{pH}_{\min} =-\log_{10}(7.7948\times10^{-4}) =3.108\approx3.11}. \]
Increasing the pH increases the sulfide concentration, so precipitation becomes favorable above this threshold. The copper sulfide solubility product is unnecessary because step 5 selectively transfers nickel into the solution.
The solution was checked against the official solution. Where this solution differs from the official solution, the official solution contains an error or a misprint.
IChO 2020 · Theorieaufgabe 9
Quantifizierung von Schwermetallionen
| 12% der Gesamtpunktzahl | Punkte | 5 | 5 | 8 | 16 | 5 | 6 | 25 | 30 | 100 |
Aufgabe 9. Quantifizierung von Schwermetallionen
Zur quantitativen Analyse von Schwermetallionen im Abwasserbecken einer Fabrik wurden von einer analysierenden Person bei 298 K die folgenden Schritte durchgeführt:
Schritt 1) Aus fünf verschiedenen Bereichen eines Abwasserbeckens wurden jeweils 10-mL-Proben entnommen, in einem 100-mL-Becherglas gemischt und anschließend 5 Minuten lang mit einem Magnetrührer gerührt.
Schritt 2) Dem 100-mL-Becherglas wurden 10 mL Probenlösung entnommen und unter Rühren 142 mg \(\ce{Na2SO4}\) zugegeben. Anschließend wurde die Lösung in eine Drei-Elektroden-Zelle überführt, wie in Abbildung 1a gezeigt. In dieser elektrochemischen Zelle dienten ein \(\ce{Pt}\)-Draht, \(\ce{Ag/AgCl}\) (3 M \(\ce{KCl}\)) und eine \(\ce{Pt}\)-Folie als Arbeits-, Referenz- bzw. Gegenelektrode.
Schritt 3) Diese Elektroden wurden an einen Potentiostaten angeschlossen, und es wurde 14 Minuten lang ein konstantes Potential von −0.50 V gegen \(\ce{Ag/AgCl}\) angelegt, wie in Abbildung 1b gezeigt (waagerechte Linie). Es wird angenommen, dass 14 min ausreichen, um die erwarteten elektrochemischen Reaktionen vollständig ablaufen zu lassen.
Abbildung 1. a) Aufbau der elektrochemischen Zelle; 1) Arbeitselektrode (\(\ce{Pt}\)-Draht), 2) Referenzelektrode (\(\ce{Ag/AgCl}\), 3M \(\ce{KCl}\)), 3) Gegenelektrode (\(\ce{Pt}\)-Folie), 4) Zellenhahn, 5) elektrochemische Zelle, 6) 10 mL Probenlösung. b) Änderung des Potentials der Arbeitselektrode als Funktion der Zeit. y-Achse: Potential/V gegen \(\ce{Ag/AgCl}\), x-Achse: Zeit/min.
Schritt 4) Die Elektroden wurden mit destilliertem Wasser gespült und in eine weitere elektrochemische Zelle mit 10 mL einer 0.1 M \(\ce{H2SO4}\)-Lösung eingesetzt. Das Potential wurde zwischen −0.50 und +0.50 V durchfahren, wie in Abbildung 1b gezeigt (abfallende Linie innerhalb von 2 min). Die Strom-Potential-Daten für diesen Schritt sind in Abbildung 2a dargestellt, die einer eindrucksvollen Ansicht des Ararat (Ağrı Dağı), des höchsten Berges der Türkei, ähnelt (Abbildung 2b).
Abbildung 2. a) Potentialdurchlauf der Arbeitselektrode als Funktion des Stroms in einer 0.1 M \(\ce{H2SO4}\)-Lösung, nachdem ihr Potential in 10 mL Abwasserprobe konstant bei −0.50 V gehalten wurde, wie in Abbildung 1b gezeigt (waagerechte Linie). y-Achse: Strom/μA, x-Achse: Potential/V gegen \(\ce{Ag/AgCl}\), b) Ansicht der Gipfel des Großen und Kleinen Ararat.
Schritt 5) Weitere 10 mL der in Schritt 1 hergestellten Probenlösung wurden entnommen und die in den Schritten 2 und 3 erläuterten Verfahren in dieser Reihenfolge durchgeführt. Die Elektroden wurden mit destilliertem Wasser gespült und in 10 mL einer 0.1 M \(\ce{H2SO4}\)-Lösung eingesetzt. Anschließend wurde das Potential der Arbeitselektrode 14 Minuten lang konstant bei +0.05 V gehalten. Es wird angenommen, dass 14 min ausreichen, um die erwarteten elektrochemischen Reaktionen vollständig ablaufen zu lassen.
Schritt 6) Nach Durchführung von Schritt 5 wurde die Lösung aus der elektrochemischen Zelle in einem geeigneten Ofen bei 150 °C eingedampft, bis ein trockener Feststoff erhalten wurde.
Schritt 7) Zum in Schritt 6 erhaltenen Feststoff wurden 5 mL einer Lösung von Ethylendiamintetraessigsäure (EDTA, \(\ce{H4Y}\)) (Abbildung 3) gegeben, und es wurde zum Lösen geschüttelt. Es ist bekannt, dass 1 mL EDTA-Lösung 3.85 mg/mL \(\ce{BaCO3}\) entspricht. Anschließend wurde der pH-Wert der Lösung auf 10.0 eingestellt. Die überschüssige EDTA wurde mit einer 0.0010 M \(\ce{Ni(NO3)2}\)-Maßlösung titriert. Dabei wurde beobachtet, dass bis zum Endpunkt 95.60 mL \(\ce{Ni(NO3)2}\)-Lösung verbraucht wurden.
Abbildung 3. Chemische Struktur von EDTA (\(\ce{H4Y}\)).
- In mit \(\ce{H2S}\) gesättigtem Wasser beträgt die Gleichgewichtskonzentration \([\ce{H2S}]\) 0.1 M.
- \(K_{\mathrm{sp}}(\ce{NiS})=4.0\times10^{-20}\); \(K_{\mathrm{sp}}(\ce{CuS})=1.0\times10^{-36}\)
- \(K_{\mathrm{a1}}(\ce{H2S})=9.6\times10^{-8}\); \(K_{\mathrm{a2}}(\ce{H2S})=1.3\times10^{-14}\)
| Reaktion | \(E^\circ/\mathrm{V}\) (bei 298 K) |
|---|---|
| \(\ce{2H2O(l) + 2e- -> H2(g) + 2OH-(aq)}\) | −0.83 |
| \(\ce{Ni^2+(aq) + 2e- -> Ni(s)}\) | −0.24 |
| \(\ce{2H+(aq) + 2e- -> H2(g)}\) | 0.00 |
| \(\ce{Cu^2+(aq) + 2e- -> Cu(s)}\) | +0.34 |
| \(\ce{Ag+(aq) + e- -> Ag(s)}\) | +0.80 |
| \(\ce{O2(g) + 4H+(aq) + 4e- -> 2H2O(l)}\) | +1.23 |
9.1. Welche der folgenden Zuordnungen kommt für Peak 1 bzw. Peak 2 in Abbildung 2a infrage? Kreuzen Sie das richtige Kästchen auf dem Antwortbogen an.
- ☐ Peak 1: elektrochemische Reduktion von \(\ce{Ni}\) / Peak 2: elektrochemische Reduktion von \(\ce{Cu}\)
- ☐ Peak 1: elektrochemische Reduktion von \(\ce{Cu}\) / Peak 2: elektrochemische Reduktion von \(\ce{Ni}\)
- ☐ Peak 1: elektrochemische Reduktion von \(\ce{Ni}\) / Peak 2: elektrochemische Oxidation von \(\ce{Cu}\)
- ☐ Peak 1: elektrochemische Oxidation von \(\ce{Ni}\) / Peak 2: elektrochemische Oxidation von \(\ce{Cu}\)
- ☐ Peak 1: elektrochemische Oxidation von \(\ce{Cu}\) / Peak 2: elektrochemische Oxidation von \(\ce{Ni}\)
9.2. Welcher der folgenden Vorgänge ist zu erwarten, wenn im ersten Schritt (waagerechte Linie) in Abbildung 1b ein Potential von −1.2 V statt -0.5 V angelegt wird? Kreuzen Sie das richtige Kästchen auf dem Antwortbogen an.
- ☐ \(\ce{NO}\)-Entwicklung
- ☐ \(\ce{NO2}\)-Entwicklung
- ☐ Stickstoffentwicklung
- ☐ Sauerstoffentwicklung
- ☐ Wasserstoffentwicklung
9.3. Berechnen Sie die Potentialvorschubgeschwindigkeit für die in Abbildung 2a dargestellten Daten in mV/s bei 298 K.
Das Potential der folgenden Zelle wird mit 0.437 V gemessen.
\[ \ce{Pt},\ce{H2}(0.92\ \mathrm{bar}) \mid \ce{HCl}(1.50\times10^{-2}\ \mathrm{M}),\ce{AgCl}(sat) \mid\ce{Ag} \]
9.4. Berechnen Sie das Standardelektrodenpotential (V) der Halbzelle \(\ce{AgCl(s) + e- -> Ag(s) + Cl-(aq)}\) bei 298 K. Hinweis: Sie müssen den vollständigen Rechenweg angeben.
9.5. Welche der folgenden Aussagen beschreibt den Hauptzweck von Schritt 5 bei dieser Analyse? Kreuzen Sie das richtige Kästchen auf dem Antwortbogen an.
- ☐ Modifizierung des \(\ce{Pt}\)-Drahts mit einem \(\ce{Ni}\)–\(\ce{Cu}\)-Legierungsfilm
- ☐ Modifizierung des \(\ce{Pt}\)-Drahts mit einem \(\ce{Ni}\)-Film
- ☐ Elektrochemische Ablösung sowohl von \(\ce{Cu}\) als auch von \(\ce{Ni}\) vom \(\ce{Cu}\)–\(\ce{Ni}\)-modifizierten \(\ce{Pt}\)-Draht in die Lösung
- ☐ Elektrochemische Ablösung von \(\ce{Cu}\) vom \(\ce{Cu}\)–\(\ce{Ni}\)-modifizierten \(\ce{Pt}\)-Draht in die Lösung
- ☐ Elektrochemische Ablösung von \(\ce{Ni}\) vom \(\ce{Cu}\)–\(\ce{Ni}\)-modifizierten \(\ce{Pt}\)-Draht in die Lösung
9.6. Schreiben Sie die Netto-Ionengleichungen für die Komplexbildungsreaktion und die Rücktitrationsreaktion aus Schritt 7 auf den Antwortbogen
9.7. Berechnen Sie die \(\ce{Ni^2+}\)-Konzentration in mg/L im Abwasser der Fabrik. Hinweis: Sie müssen den vollständigen Rechenweg angeben.
9.8. Berechnen Sie den minimalen pH-Wert, bei dem die Fällung von \(\ce{Ni^2+}\)-Ionen in der in Schritt 5 erhaltenen Lösung beginnt, wenn \(\ce{H2S}\)-Gas bis zur Sättigung in die Lösung eingeleitet wird. Falls Sie Frage 9.7 nicht lösen können, verwenden Sie für diese Frage eine Probe mit 20 mg/L \(\ce{Ni^2+}\). Hinweis: Sie müssen den vollständigen Rechenweg angeben.
Aufgabentext aus dem offiziellen englischen Text übersetzt.
Antworten
- 9.1. Viertes Kästchen: Peak 1 ist die Nickeloxidation; Peak 2 ist die Kupferoxidation.
- 9.2. Fünftes Kästchen: Wasserstoffentwicklung, \(\ce{H2}\), SMILES
[H][H]. - 9.3. \(\boxed{v=+8.33\ \mathrm{mV\,s^{-1}}}\).
- 9.4. \(\boxed{E^\circ_{\ce{AgCl/Ag}}=+0.222\ \mathrm{V}}\), bezogen auf die Standard-Wasserstoffelektrode.
- 9.5. Fünftes Kästchen: selektive elektrochemische Ablösung von Nickel aus der Kupfer–Nickel-Abscheidung in die Lösung.
- 9.6. Komplexbildung: \(\ce{Ni^2+ + H4Y -> [NiY]^2- + 4H+}\). Rücktitration, in der Schreibweise mit vollständig deprotonierter EDTA: \(\ce{Ni^2+ + Y^4- -> [NiY]^2-}\). Die Namen und SMILES der Spezies sind unten angegeben.
- 9.7. \(\boxed{c_{\mathrm{mass}}(\ce{Ni^2+})\approx11.4\ \mathrm{mg\,L^{-1}}}\), oder ungefähr \(11\ \mathrm{mg\,L^{-1}}\) auf zwei signifikante Stellen.
- 9.8. \(\boxed{\mathrm{pH}_{\min}\approx3.11}\).
Lösung
9.1. Zuordnung der Ablösepeaks
Während des Abscheidungsschritts werden Nickel(II)-Ionen, \(\ce{Ni^2+}\), SMILES [Ni+2], und Kupfer(II)-Ionen, \(\ce{Cu^2+}\), SMILES [Cu+2], an der Arbeitselektrode reduziert und abgeschieden:
\[ \ce{Ni^2+(aq) + 2e- -> Ni(s)} \] \[ \ce{Cu^2+(aq) + 2e- -> Cu(s)} \]
Der anschließende Potentialdurchlauf verläuft von −0.50 bis +0.50 V: Er bewegt sich in Richtung eines positiveren Potentials, obwohl die Linie in Abbildung 1b abfallend erscheint. Die abgeschiedenen Metalle werden daher oxidiert und in die Lösung abgelöst.
Nickel hat das niedrigere Standardreduktionspotential:
\[ E^\circ_{\ce{Ni^2+/Ni}}=-0.24\ \mathrm{V} < E^\circ_{\ce{Cu^2+/Cu}}=+0.34\ \mathrm{V}. \]
Nickel wird folglich beim früheren, weniger positiven Ablösepeak oxidiert, gefolgt von Kupfer:
\[ \text{Peak 1:}\qquad \ce{Ni(s) -> Ni^2+(aq) + 2e-} \] \[ \text{Peak 2:}\qquad \ce{Cu(s) -> Cu^2+(aq) + 2e-}. \]
Somit ist das vierte Kästchen anzukreuzen.
9.2. Auswirkung des Anlegens von −1.2 V
Das deutlich negativere Potential der Arbeitselektrode begünstigt die Reduktion von Wasser und die Wasserstoffentwicklung:
\[ \ce{2H2O(l) + 2e- -> H2(g) + 2OH-(aq)}. \]
Die Spezies sind Wasser, SMILES O; Wasserstoff, SMILES [H][H]; und das Hydroxidion, SMILES [OH-].
Somit ist das fünfte Kästchen anzukreuzen: Wasserstoffentwicklung.
9.3. Potentialvorschubgeschwindigkeit
Das Potential ändert sich um \(1.00\ \mathrm{V}\) innerhalb von \(2\ \mathrm{min}=120\ \mathrm{s}\):
\[ v=\frac{\Delta E}{\Delta t} =\frac{(+0.50)-(-0.50)}{120} =8.333\times10^{-3}\ \mathrm{V\,s^{-1}}. \]
Daher gilt:
\[ \boxed{v=+8.33\ \mathrm{mV\,s^{-1}}}. \]
Das positive Vorzeichen zeigt ein zunehmendes Potential an.
9.4. Standardpotential der Silber/Silberchlorid-Elektrode
Salzsäure liefert Wasserstoffionen, \(\ce{H+}\), SMILES [H+], und Chloridionen, \(\ce{Cl-}\), SMILES [Cl-]. Silber(I)-chlorid hat die SMILES-Darstellung der ionischen Bestandteile [Ag+].[Cl-]; diese gibt seine Bestandteile an, nicht sein Kristallgitter.
An der linken Elektrode findet eine Oxidation statt:
\[ \ce{H2(g) -> 2H+(aq) + 2e-}. \]
An der rechten Elektrode findet eine Reduktion statt:
\[ \ce{2AgCl(s) + 2e- -> 2Ag(s) + 2Cl-(aq)}. \]
Die Gesamtreaktion der Zelle lautet daher
\[ \ce{H2(g) + 2AgCl(s) -> 2H+(aq) + 2Ag(s) + 2Cl-(aq)}. \]
Es werden zwei Elektronen übertragen, und der Reaktionsquotient lautet
\[ Q=\frac{a_{\ce{H+}}^2a_{\ce{Cl-}}^2} {p_{\ce{H2}}/p^\circ}. \]
Setzt man die Aktivitäten in der Lösung gleich den durch die Standardkonzentration geteilten Konzentrationen und vernachlässigt den geringen Chloridbeitrag aus gelöstem Silberchlorid, so gilt:
\[ a_{\ce{H+}}=a_{\ce{Cl-}}=1.50\times10^{-2}, \qquad \frac{p_{\ce{H2}}}{p^\circ}=0.92. \]
Damit ergibt sich:
\[ Q=\frac{(1.50\times10^{-2})^4}{0.92} =5.5027\times10^{-8}. \]
Da die Standard-Wasserstoffelektrode das Potential \(E^\circ=0\) hat, gilt:
\[ E^\circ_{\mathrm{cell}}=E^\circ_{\ce{AgCl/Ag}}. \]
Die Nernst-Gleichung ergibt
\[ E_{\mathrm{cell}} =E^\circ_{\mathrm{cell}}-\frac{RT}{2F}\ln Q, \]
also erhält man mit \(R=8.314\ \mathrm{J\,mol^{-1}\,K^{-1}}\) und \(F=96485\ \mathrm{C\,mol^{-1}}\):
\[ \begin{aligned} E^\circ_{\ce{AgCl/Ag}} &=0.437+ \frac{(8.314)(298)}{2(96485)} \ln(5.5027\times10^{-8})\\ &=0.437-0.2146\\ &=0.2224\ \mathrm{V}. \end{aligned} \]
Daher gilt:
\[ \boxed{E^\circ_{\ce{AgCl/Ag}}=+0.222\ \mathrm{V}\text{ gegen SHE}}. \]
9.5. Zweck von Schritt 5
In Abbildung 2a liegt +0.05 V nach dem Nickel-Ablösepeak und vor dem Kupfer-Ablösepeak. Wird die Elektrode auf diesem Potential gehalten, wird abgeschiedenes Nickel selektiv oxidiert:
\[ \ce{Ni(s) -> Ni^2+(aq) + 2e-}. \]
Unter der in der Aufgabe angegebenen Annahme einer vollständigen Reaktion wird Nickel in die frische Säurelösung überführt, während Kupfer auf der Elektrode verbleibt. Dadurch wird Nickel für seine anschließende Bestimmung abgetrennt.
Somit ist das fünfte Kästchen anzukreuzen.
9.6. Gleichungen für Komplexbildung und Rücktitration
Der Ligand und der Komplex sind:
- Ethylendiamintetraessigsäure, \(\ce{H4Y}\):
O=C(O)CN(CC(=O)O)CCN(CC(=O)O)CC(=O)O - Ethylendiamintetraacetat-Ion, \(\ce{Y^4-}\):
O=C([O-])CN(CC(=O)[O-])CCN(CC(=O)[O-])CC(=O)[O-] - Nickel(II)–EDTA-Komplex, \(\ce{[NiY]^2-}\), mit SMILES für koordinative Bindungen:
[Ni+2]12345<-N(CC(=O)[O-]->1)(CC(=O)[O-]->2)CCN->3(CC(=O)[O-]->4)CC(=O)[O-]->5
EDTA koordiniert über seine beiden Amin-Stickstoffatome und jeweils ein Sauerstoffatom seiner vier Carboxylatgruppen. Daraus ergibt sich eine annähernd oktaedrische Koordinationsumgebung des Nickels. Die SMILES-Darstellung gibt die Verknüpfung der Donoratome an; ein bestimmtes Koordinationsstereoisomer oder eine bestimmte Konformation wird nicht festgelegt.
Für die Komplexbildung des Nickels aus der Probe, geschrieben mit der in der Aufgabe angegebenen Säure, gilt:
\[ \boxed{\ce{Ni^2+(aq) + H4Y(aq) -> [NiY]^2-(aq) + 4H+(aq)}}. \]
Für die Rücktitration der überschüssigen EDTA, geschrieben mit dem vollständig deprotonierten Liganden, gilt:
\[ \boxed{\ce{Ni^2+(aq) + Y^4-(aq) -> [NiY]^2-(aq)}}. \]
Dies sind alternative Schreibweisen hinsichtlich der Protonierung für dieselbe zugrunde liegende Komplexbildung. Die zweite Gleichung setzt nicht voraus, dass die gesamte unkomplexierte EDTA bei pH 10 als \(\ce{Y^4-}\) vorliegt; die Komplexbildung wird von Protonierungsgleichgewichten begleitet.
Entscheidend ist, dass in beiden Stufen ein Mol Nickel(II) ein Mol EDTA verbraucht.
9.7. Nickelkonzentration im Abwasser
Die Titerangabe der EDTA-Lösung ist als ein Bariumcarbonat-Äquivalent von \(3.85\ \mathrm{mg}\) pro Milliliter EDTA-Lösung zu interpretieren.
Bariumcarbonat, \(\ce{BaCO3}\), hat die SMILES-Darstellung der ionischen Bestandteile [Ba+2].[O-]C(=O)[O-]. Jedes Mol enthält ein Mol Barium(II)-Ionen, [Ba+2], was in einem 1:1-Metall–EDTA-Komplex einem Mol EDTA entspricht.
Mit
\[ M(\ce{BaCO3})=197.34\ \mathrm{g\,mol^{-1}}, \qquad M(\ce{Ni})=58.69\ \mathrm{g\,mol^{-1}}, \]
ergibt sich die EDTA-Konzentration zu
\[ c_{\mathrm{EDTA}} = \frac{3.85\times10^{-3}\ \mathrm{g}/ (197.34\ \mathrm{g\,mol^{-1}})} {1.00\times10^{-3}\ \mathrm{L}} = 0.0195095\ \mathrm{mol\,L^{-1}}. \]
Die mit \(5\ \mathrm{mL}\) zugegebene Stoffmenge beträgt
\[ n_{\mathrm{EDTA,added}} =(0.005\ \mathrm{L})(0.0195095\ \mathrm{mol\,L^{-1}}) =9.75474\times10^{-5}\ \mathrm{mol}. \]
Mit der Rücktitration wird die nicht verbrauchte EDTA bestimmt:
\[ \begin{aligned} n_{\mathrm{EDTA,excess}} &=n_{\mathrm{Ni,titrant}}\\ &=(0.09560\ \mathrm{L})(0.0010\ \mathrm{mol\,L^{-1}})\\ &=9.560\times10^{-5}\ \mathrm{mol}. \end{aligned} \]
Unter Beibehaltung zusätzlicher Stellen bei der Subtraktion ergibt sich für die aus dem Abwasseraliquot zurückgewonnene Nickelstoffmenge:
\[ \begin{aligned} n_{\mathrm{Ni,sample}} &=n_{\mathrm{EDTA,added}}-n_{\mathrm{EDTA,excess}}\\ &=9.75474\times10^{-5}-9.560\times10^{-5}\\ &=1.9474\times10^{-6}\ \mathrm{mol}. \end{aligned} \]
Dieses Nickel stammt aus \(10\ \mathrm{mL}=0.010\ \mathrm{L}\) Abwasser. Somit gilt:
\[ \begin{aligned} c_{\mathrm{mass}}(\ce{Ni^2+}) &=\frac{(1.9474\times10^{-6}\ \mathrm{mol}) (58.69\ \mathrm{g\,mol^{-1}}) (10^3\ \mathrm{mg\,g^{-1}})} {0.010\ \mathrm{L}}\\ &=11.429\ \mathrm{mg\,L^{-1}}. \end{aligned} \]
Das nominelle Rechenergebnis lautet somit
\[ \boxed{c_{\mathrm{mass}}(\ce{Ni^2+})\approx11.4\ \mathrm{mg\,L^{-1}}}, \]
oder ungefähr \(11\ \mathrm{mg\,L^{-1}}\) auf zwei signifikante Stellen.
Das 100-mL-Becherglas führt keinen Verdünnungsfaktor ein: Fünf 10-mL-Portionen wurden gemischt, ohne dass eine Verdünnung auf 100 mL vorgeschrieben war. Das Ergebnis bezieht sich auf die vereinigte Abwasserprobe.
9.8. Minimaler pH-Wert für die Nickelsulfidfällung
Das in Schritt 5 zurückgewonnene Nickel ist in \(10\ \mathrm{mL}\) enthalten, sodass seine Konzentration vor der Fällung beträgt:
\[ [\ce{Ni^2+}] =\frac{1.9474\times10^{-6}\ \mathrm{mol}}{0.010\ \mathrm{L}} =1.9474\times10^{-4}\ \mathrm{mol\,L^{-1}}. \]
Die Schwefelspezies sind Schwefelwasserstoff, \(\ce{H2S}\), SMILES S; das Hydrogensulfidion, \(\ce{HS-}\), SMILES [SH-]; und das Sulfidion, \(\ce{S^2-}\), SMILES [S-2].
Ihre Säuredissoziationsgleichgewichte lauten
\[ \ce{H2S(aq) <=> H+(aq) + HS-(aq)} \]
und
\[ \ce{HS-(aq) <=> H+(aq) + S^2-(aq)}. \]
Die Multiplikation der beiden Gleichgewichtsausdrücke ergibt
\[ K_{\mathrm{a1}}K_{\mathrm{a2}} = \frac{[\ce{H+}]^2[\ce{S^2-}]}{[\ce{H2S}]}. \]
Daher gilt:
\[ [\ce{S^2-}] = \frac{K_{\mathrm{a1}}K_{\mathrm{a2}}[\ce{H2S}]} {[\ce{H+}]^2}. \]
Nickel(II)-sulfid, \(\ce{NiS}\), hat die SMILES-Darstellung der ionischen Bestandteile [Ni+2].[S-2]; seine Fällungsreaktion lautet
\[ \ce{Ni^2+(aq) + S^2-(aq) -> NiS(s)}. \]
Zu Beginn der Fällung gilt:
\[ [\ce{Ni^2+}][\ce{S^2-}]=K_{\mathrm{sp}}. \]
Die erforderliche Sulfidkonzentration beträgt somit
\[ [\ce{S^2-}]_{\mathrm{crit}} = \frac{4.0\times10^{-20}}{1.9474\times10^{-4}} = 2.0540\times10^{-16}\ \mathrm{mol\,L^{-1}}. \]
Mit der angegebenen Sättigungskonzentration \([\ce{H2S}]=0.1\ \mathrm{M}\) ergibt sich:
\[ \begin{aligned} [\ce{H+}] &= \sqrt{ \frac{K_{\mathrm{a1}}K_{\mathrm{a2}}[\ce{H2S}]} {[\ce{S^2-}]_{\mathrm{crit}}} }\\ &= \sqrt{ \frac{(9.6\times10^{-8})(1.3\times10^{-14})(0.1)} {2.0540\times10^{-16}} }\\ &=7.7948\times10^{-4}\ \mathrm{mol\,L^{-1}}. \end{aligned} \]
Folglich gilt:
\[ \boxed{\mathrm{pH}_{\min} =-\log_{10}(7.7948\times10^{-4}) =3.108\approx3.11}. \]
Mit zunehmendem pH-Wert steigt die Sulfidkonzentration, sodass die Fällung oberhalb dieses Schwellenwerts begünstigt wird. Das Löslichkeitsprodukt von Kupfersulfid wird nicht benötigt, da in Schritt 5 selektiv Nickel in die Lösung überführt wird.
Die Lösung wurde mit der offiziellen Lösung abgeglichen. Wo diese Lösung von der offiziellen Lösung abweicht, enthält die offizielle Lösung einen Fehler oder Druckfehler.
IChO 2020 · Teori sorusu 9
Ağır Metal İyonlarının Nicel Tayini
| Toplamın %12'si | Puanlar | 5 | 5 | 8 | 16 | 5 | 6 | 25 | 30 | 100 |
Soru 9. Ağır Metal İyonlarının Nicel Tayini
Bir fabrikanın atık su havuzundaki ağır metal iyonlarının nicel analizi için bir analist tarafından 298 K'de aşağıdaki adımlar uygulanmıştır:
Adım 1) Bir atık su havuzunun beş farklı bölgesinin her birinden 10 mL'lik örnekler alınmış, 100 mL'lik bir beherde birleştirilmiş ve ardından manyetik karıştırıcı kullanılarak 5 dakika boyunca karıştırılmıştır.
Adım 2) 100 mL'lik beherden 10 mL örnek çözeltisi alınmış ve karıştırılarak 142 mg \(\ce{Na2SO4}\) eklenmiş, ardından Şekil 1a'da görülen üç elektrotlu hücreye aktarılmıştır. Bu elektrokimyasal hücrede \(\ce{Pt}\) tel, \(\ce{Ag/AgCl}\) (3 M \(\ce{KCl}\)) ve \(\ce{Pt}\) levha sırasıyla çalışma elektrodu, referans elektrot ve karşıt elektrot olarak kullanılmıştır.
Adım 3) Bu elektrotlar bir potansiyostata bağlanmış ve Şekil 1b'de (yatay çizgi) görüldüğü gibi 14 dakika boyunca \(\ce{Ag/AgCl}\)'ye göre −0.50 V sabit potansiyel uygulanmıştır. Beklenen elektrokimyasal tepkimelerin tamamlanması için 14 dakikanın yeterli olduğu varsayılmaktadır.
Şekil 1. a) Elektrokimyasal hücre tasarımı; 1) çalışma elektrodu (\(\ce{Pt}\) tel), 2) referans elektrot (\(\ce{Ag/AgCl}\), 3M \(\ce{KCl}\)), 3) karşıt elektrot (\(\ce{Pt}\) levha), 4) hücre musluğu, 5) elektrokimyasal hücre, 6) 10 mL örnek çözeltisi. b) Çalışma elektrodunun potansiyelinin zamana bağlı değişimi. y ekseni: \(\ce{Ag/AgCl}\)'ye göre potansiyel/V, x ekseni: zaman/dakika.
Adım 4) Elektrotlar damıtık suyla durulanmış, 10 mL 0.1 M \(\ce{H2SO4}\) çözeltisi içeren başka bir elektrokimyasal hücreye yerleştirilmiş ve Şekil 1b'de (2 dakika boyunca aşağı eğimli çizgi) görüldüğü gibi −0.50 ile +0.50 V arasında potansiyel taraması yapılmıştır. Bu adıma ait akım-potansiyel verileri, Türkiye'nin en yüksek dağı olan Ağrı Dağı'nın (Şekil 2b) muhteşem bir görünümüne benzeyen Şekil 2a'da sunulmuştur.
Şekil 2. a) Çalışma elektrodu, Şekil 1b'de (yatay çizgi) görüldüğü gibi 10 mL atık su örneğinde −0.50 V sabit potansiyelde tutulduktan sonra, 0.1 M \(\ce{H2SO4}\) çözeltisinde akımın fonksiyonu olarak potansiyel taraması. y ekseni: akım/μA, x ekseni: \(\ce{Ag/AgCl}\)'ye göre potansiyel/V, b) Büyük ve Küçük Ağrı zirvelerinin bir görünümü.
Adım 5) 1. adımda hazırlanan örnek çözeltisinden 10 mL daha alınmış ve 2. ve 3. adımlarda açıklanan işlemler bu sırayla uygulanmıştır. Elektrotlar damıtık suyla durulanmış ve 10 mL 0.1 M \(\ce{H2SO4}\) çözeltisine yerleştirilmiştir. Ardından çalışma elektrodunun potansiyeli 14 dakika boyunca +0.05 V'de sabit tutulmuştur. Beklenen elektrokimyasal tepkimelerin tamamlanması için 14 dakikanın yeterli olduğu varsayılmaktadır.
Adım 6) 5. adım gerçekleştirildikten sonra elektrokimyasal hücredeki çözelti, kuru katı elde edilene kadar 150 °C'de buharlaştırılmak üzere uygun bir etüve yerleştirilmiştir.
Adım 7) 6. adımda elde edilen katıya 5 mL etilendiamintetraasetik asit (EDTA, \(\ce{H4Y}\)) (Şekil 3) çözeltisi eklenmiş ve çözünmesi için çalkalanmıştır. 1 mL EDTA çözeltisinin 3.85 mg/mL \(\ce{BaCO3}\)'e eşdeğer olduğu bilinmektedir. Ardından çözeltinin pH'sı 10.0'a ayarlanmıştır. EDTA'nın fazlası standart 0.0010 M \(\ce{Ni(NO3)2}\) çözeltisiyle titre edilmiş ve dönüm noktasına kadar 95.60 mL \(\ce{Ni(NO3)2}\) çözeltisi harcandığı gözlenmiştir.
Şekil 3. EDTA'nın (\(\ce{H4Y}\)) kimyasal yapısı.
- \(\ce{H2S}\) ile doymuş suda, \([\ce{H2S}]\) denge derişimi 0.1 M'dır.
- \(K_{\mathrm{sp}}(\ce{NiS})=4.0\times10^{-20}\); \(K_{\mathrm{sp}}(\ce{CuS})=1.0\times10^{-36}\)
- \(K_{\mathrm{a1}}(\ce{H2S})=9.6\times10^{-8}\); \(K_{\mathrm{a2}}(\ce{H2S})=1.3\times10^{-14}\)
| Tepkime | \(E^\circ/\mathrm{V}\) (298 K'de) |
|---|---|
| \(\ce{2H2O(l) + 2e- -> H2(g) + 2OH-(aq)}\) | −0.83 |
| \(\ce{Ni^2+(aq) + 2e- -> Ni(s)}\) | −0.24 |
| \(\ce{2H+(aq) + 2e- -> H2(g)}\) | 0.00 |
| \(\ce{Cu^2+(aq) + 2e- -> Cu(s)}\) | +0.34 |
| \(\ce{Ag+(aq) + e- -> Ag(s)}\) | +0.80 |
| \(\ce{O2(g) + 4H+(aq) + 4e- -> 2H2O(l)}\) | +1.23 |
9.1. Şekil 2a'daki pik 1 ve pik 2 için sırasıyla aşağıdakilerden hangisi düşünülebilir? Cevap kâğıdındaki doğru kutucuğu işaretleyiniz.
- ☐ Pik 1: \(\ce{Ni}\)'nin elektrokimyasal indirgenmesi / Pik 2: \(\ce{Cu}\)'ın elektrokimyasal indirgenmesi
- ☐ Pik 1: \(\ce{Cu}\)'ın elektrokimyasal indirgenmesi / Pik 2: \(\ce{Ni}\)'nin elektrokimyasal indirgenmesi
- ☐ Pik 1: \(\ce{Ni}\)'nin elektrokimyasal indirgenmesi / Pik 2: \(\ce{Cu}\)'ın elektrokimyasal yükseltgenmesi
- ☐ Pik 1: \(\ce{Ni}\)'nin elektrokimyasal yükseltgenmesi / Pik 2: \(\ce{Cu}\)'ın elektrokimyasal yükseltgenmesi
- ☐ Pik 1: \(\ce{Cu}\)'ın elektrokimyasal yükseltgenmesi / Pik 2: \(\ce{Ni}\)'nin elektrokimyasal yükseltgenmesi
9.2. Şekil 1b'deki ilk adımda (yatay çizgi) potansiyel -0.5 V yerine −1.2 V olarak uygulanırsa aşağıdakilerden hangisinin gerçekleşmesi beklenir? Cevap kâğıdındaki doğru kutucuğu işaretleyiniz.
- ☐ \(\ce{NO}\) gazı çıkışı
- ☐ \(\ce{NO2}\) gazı çıkışı
- ☐ Azot gazı çıkışı
- ☐ Oksijen gazı çıkışı
- ☐ Hidrojen gazı çıkışı
9.3. Şekil 2a'da sunulan verilerin 298 K'deki tarama hızını mV/s cinsinden hesaplayınız.
Aşağıdaki hücrenin potansiyeli 0.437 V olarak ölçülmüştür.
\[ \ce{Pt},\ce{H2}(0.92\ \mathrm{bar}) \mid \ce{HCl}(1.50\times10^{-2}\ \mathrm{M}),\ce{AgCl}(sat) \mid\ce{Ag} \]
9.4. \(\ce{AgCl(s) + e- -> Ag(s) + Cl-(aq)}\) yarı hücresinin 298 K'deki standart elektrot potansiyelini (V) hesaplayınız. Not: Tüm işlemleri göstermelisiniz.
9.5. Aşağıdakilerden hangisi bu analizdeki 5. adımın temel amacıdır? Cevap kâğıdındaki doğru kutucuğu işaretleyiniz.
- ☐ \(\ce{Pt}\) telin \(\ce{Ni}\)–\(\ce{Cu}\) alaşım filmiyle modifiye edilmesi
- ☐ \(\ce{Pt}\) telin \(\ce{Ni}\) filmiyle modifiye edilmesi
- ☐ Hem \(\ce{Cu}\)'ın hem de \(\ce{Ni}\)'nin \(\ce{Cu}\)–\(\ce{Ni}\) ile modifiye edilmiş \(\ce{Pt}\) telden elektrokimyasal olarak sıyrılarak çözeltiye geçirilmesi
- ☐ \(\ce{Cu}\)'ın \(\ce{Cu}\)–\(\ce{Ni}\) ile modifiye edilmiş \(\ce{Pt}\) telden elektrokimyasal olarak sıyrılarak çözeltiye geçirilmesi
- ☐ \(\ce{Ni}\)'nin \(\ce{Cu}\)–\(\ce{Ni}\) ile modifiye edilmiş \(\ce{Pt}\) telden elektrokimyasal olarak sıyrılarak çözeltiye geçirilmesi
9.6. 7. adımdaki kompleksleşme ve geri titrasyon tepkimelerinin net iyon denklemlerini cevap kâğıdına yazınız
9.7. Fabrikanın atık suyundaki \(\ce{Ni^2+}\) derişimini mg/L cinsinden hesaplayınız. Not: Tüm işlemleri göstermelisiniz.
9.8. 5. adımda elde edilen çözeltiden doygunluğa ulaşıncaya kadar \(\ce{H2S}\) gazı geçirilerek çözeltideki \(\ce{Ni^2+}\) iyonlarının çökelmeye başlaması için gereken en düşük pH değerini hesaplayınız. 9.7 sorusunu çözemediyseniz bu soru için 20 mg/L \(\ce{Ni^2+}\) içeren örneği kullanınız. Not: Tüm işlemleri göstermelisiniz.
Soru metni resmi İngilizce metinden çevrilmiştir.
Cevaplar
- 9.1. Dördüncü kutucuk: pik 1 nikelin yükseltgenmesidir; pik 2 bakırın yükseltgenmesidir.
- 9.2. Beşinci kutucuk: hidrojen gazı çıkışı, \(\ce{H2}\), SMILES
[H][H]. - 9.3. \(\boxed{v=+8.33\ \mathrm{mV\,s^{-1}}}\).
- 9.4. Standart hidrojen elektroduna göre \(\boxed{E^\circ_{\ce{AgCl/Ag}}=+0.222\ \mathrm{V}}\).
- 9.5. Beşinci kutucuk: nikelin bakır–nikel birikintisinden seçici olarak elektrokimyasal sıyrılmayla çözeltiye geçirilmesi.
- 9.6. Kompleksleşme: \(\ce{Ni^2+ + H4Y -> [NiY]^2- + 4H+}\). Tamamen deprotonlanmış EDTA gösterimi kullanılarak geri titrasyon: \(\ce{Ni^2+ + Y^4- -> [NiY]^2-}\). Türlerin adları ve SMILES gösterimleri aşağıda verilmiştir.
- 9.7. \(\boxed{c_{\mathrm{mass}}(\ce{Ni^2+})\approx11.4\ \mathrm{mg\,L^{-1}}}\) veya iki anlamlı rakamla yaklaşık \(11\ \mathrm{mg\,L^{-1}}\).
- 9.8. \(\boxed{\mathrm{pH}_{\min}\approx3.11}\).
Çözüm
9.1. Sıyırma piklerinin belirlenmesi
Biriktirme adımı sırasında nikel(II) iyonları, \(\ce{Ni^2+}\), SMILES [Ni+2], ve bakır(II) iyonları, \(\ce{Cu^2+}\), SMILES [Cu+2], çalışma elektrodu üzerine indirgenerek biriktirilir:
\[ \ce{Ni^2+(aq) + 2e- -> Ni(s)} \] \[ \ce{Cu^2+(aq) + 2e- -> Cu(s)} \]
Sonraki tarama −0.50 V'den +0.50 V'ye ilerler: Şekil 1b'deki çizginin aşağı yönlü görünmesine rağmen daha pozitif potansiyele doğru gidilir. Bu nedenle biriktirilen metaller yükseltgenir ve sıyrılarak çözeltiye geçer.
Nikelin standart indirgenme potansiyeli daha düşüktür:
\[ E^\circ_{\ce{Ni^2+/Ni}}=-0.24\ \mathrm{V} < E^\circ_{\ce{Cu^2+/Cu}}=+0.34\ \mathrm{V}. \]
Dolayısıyla nikel, daha önce görülen ve daha az pozitif olan sıyırma pikinde yükseltgenir; ardından bakır yükseltgenir:
\[ \text{Pik 1:}\qquad \ce{Ni(s) -> Ni^2+(aq) + 2e-} \] \[ \text{Pik 2:}\qquad \ce{Cu(s) -> Cu^2+(aq) + 2e-}. \]
Bu nedenle dördüncü kutucuğu işaretleyiniz.
9.2. −1.2 V uygulanmasının etkisi
Çalışma elektrodunun çok daha negatif olan potansiyeli, suyun indirgenmesini ve hidrojen gazı çıkışını destekler:
\[ \ce{2H2O(l) + 2e- -> H2(g) + 2OH-(aq)}. \]
Türler su, SMILES O; hidrojen, SMILES [H][H]; ve hidroksit iyonu, SMILES [OH-] şeklindedir.
Bu nedenle beşinci kutucuğu işaretleyiniz: hidrojen gazı çıkışı.
9.3. Tarama hızı
Potansiyeldeki \(1.00\ \mathrm{V}\) değişim, \(2\ \mathrm{min}=120\ \mathrm{s}\) içinde gerçekleşir:
\[ v=\frac{\Delta E}{\Delta t} =\frac{(+0.50)-(-0.50)}{120} =8.333\times10^{-3}\ \mathrm{V\,s^{-1}}. \]
Dolayısıyla,
\[ \boxed{v=+8.33\ \mathrm{mV\,s^{-1}}}. \]
Pozitif işaret, potansiyelin arttığını gösterir.
9.4. Gümüş/gümüş klorür elektrodunun standart potansiyeli
Hidroklorik asit, hidrojen iyonlarını, \(\ce{H+}\), SMILES [H+], ve klorür iyonlarını, \(\ce{Cl-}\), SMILES [Cl-], sağlar. Gümüş(I) klorürün iyonik bileşenlerini gösteren SMILES ifadesi [Ag+].[Cl-] şeklindedir; bu gösterim kristal örgüsünü değil, bileşenlerini belirtir.
Soldaki elektrotta yükseltgenme gerçekleşir:
\[ \ce{H2(g) -> 2H+(aq) + 2e-}. \]
Sağdaki elektrotta indirgenme gerçekleşir:
\[ \ce{2AgCl(s) + 2e- -> 2Ag(s) + 2Cl-(aq)}. \]
Buna göre toplam hücre tepkimesi şöyledir:
\[ \ce{H2(g) + 2AgCl(s) -> 2H+(aq) + 2Ag(s) + 2Cl-(aq)}. \]
İki elektron aktarılır ve tepkime bölümü şöyledir:
\[ Q=\frac{a_{\ce{H+}}^2a_{\ce{Cl-}}^2} {p_{\ce{H2}}/p^\circ}. \]
Çözeltideki aktiviteler, derişimlerin standart derişime bölünmesiyle alınır ve çözünmüş gümüş klorürden gelen küçük klorür katkısı ihmal edilirse,
\[ a_{\ce{H+}}=a_{\ce{Cl-}}=1.50\times10^{-2}, \qquad \frac{p_{\ce{H2}}}{p^\circ}=0.92. \]
Böylece,
\[ Q=\frac{(1.50\times10^{-2})^4}{0.92} =5.5027\times10^{-8}. \]
Standart hidrojen elektrodu için \(E^\circ=0\) olduğundan,
\[ E^\circ_{\mathrm{cell}}=E^\circ_{\ce{AgCl/Ag}}. \]
Nernst denklemi şu ifadeyi verir:
\[ E_{\mathrm{cell}} =E^\circ_{\mathrm{cell}}-\frac{RT}{2F}\ln Q, \]
dolayısıyla \(R=8.314\ \mathrm{J\,mol^{-1}\,K^{-1}}\) ve \(F=96485\ \mathrm{C\,mol^{-1}}\) kullanıldığında,
\[ \begin{aligned} E^\circ_{\ce{AgCl/Ag}} &=0.437+ \frac{(8.314)(298)}{2(96485)} \ln(5.5027\times10^{-8})\\ &=0.437-0.2146\\ &=0.2224\ \mathrm{V}. \end{aligned} \]
Dolayısıyla,
\[ \boxed{E^\circ_{\ce{AgCl/Ag}}=+0.222\ \mathrm{V}\text{ SHE'ye göre}}. \]
9.5. 5. adımın amacı
Şekil 2a'da +0.05 V, nikelin sıyırma pikinden sonra ve bakırın sıyırma pikinden önce yer alır. Elektrodu bu potansiyelde tutmak, biriktirilmiş nikeli seçici olarak yükseltger:
\[ \ce{Ni(s) -> Ni^2+(aq) + 2e-}. \]
Soruda belirtilen tepkimenin tamamlandığı varsayımı altında, bakır elektrotta kalırken nikel yeni asit çözeltisine aktarılır. Böylece nikel, daha sonra yapılacak tayini için ayrılmış olur.
Bu nedenle beşinci kutucuğu işaretleyiniz.
9.6. Kompleksleşme ve geri titrasyon denklemleri
Ligand ve kompleks şunlardır:
- Etilendiamintetraasetik asit, \(\ce{H4Y}\):
O=C(O)CN(CC(=O)O)CCN(CC(=O)O)CC(=O)O - Etilendiamintetraasetat iyonu, \(\ce{Y^4-}\):
O=C([O-])CN(CC(=O)[O-])CCN(CC(=O)[O-])CC(=O)[O-] - Nikel(II)–EDTA kompleksi, \(\ce{[NiY]^2-}\), koordinatif bağları gösteren SMILES kullanılarak:
[Ni+2]12345<-N(CC(=O)[O-]->1)(CC(=O)[O-]->2)CCN->3(CC(=O)[O-]->4)CC(=O)[O-]->5
EDTA, iki amin azot atomu ve dört karboksilat grubunun her birinden bir oksijen atomu aracılığıyla koordine olur. Bu, nikel çevresinde yaklaşık oktahedral bir koordinasyon ortamı oluşturur. SMILES, donör atomların bağlanma düzenini belirtir; belirli bir koordinasyon stereoizomeri veya konformasyonu seçilmemiştir.
Örnekteki nikelin kompleksleşmesi, soruda belirtilen asit kullanılarak yazıldığında,
\[ \boxed{\ce{Ni^2+(aq) + H4Y(aq) -> [NiY]^2-(aq) + 4H+(aq)}}. \]
Fazla EDTA'nın geri titrasyonu, tamamen deprotonlanmış ligand kullanılarak yazıldığında,
\[ \boxed{\ce{Ni^2+(aq) + Y^4-(aq) -> [NiY]^2-(aq)}}. \]
Bunlar, temelde aynı kompleks oluşumunun farklı protonlanma durumlarıyla gösterimleridir. İkinci denklem, pH 10'da kompleksleşmemiş EDTA'nın tamamının \(\ce{Y^4-}\) hâlinde bulunmasını gerektirmez; kompleksleşmeye protonlanma dengeleri eşlik eder.
Esas nokta, her iki aşamada da bir mol nikel(II)'nin bir mol EDTA tüketmesidir.
9.7. Atık sudaki nikel derişimi
EDTA'nın standardizasyonunu, EDTA çözeltisinin her mililitresi başına \(3.85\ \mathrm{mg}\) baryum karbonat eşdeğeri olarak yorumlayınız.
Baryum karbonatın, \(\ce{BaCO3}\), iyonik bileşenlerini gösteren SMILES ifadesi [Ba+2].[O-]C(=O)[O-] şeklindedir. Her molü, 1:1 metal–EDTA kompleksinde bir mol EDTA'ya karşılık gelen bir mol baryum(II) iyonu, [Ba+2], içerir.
Şu değerler kullanılarak,
\[ M(\ce{BaCO3})=197.34\ \mathrm{g\,mol^{-1}}, \qquad M(\ce{Ni})=58.69\ \mathrm{g\,mol^{-1}}, \]
EDTA derişimi şöyle bulunur:
\[ c_{\mathrm{EDTA}} = \frac{3.85\times10^{-3}\ \mathrm{g}/ (197.34\ \mathrm{g\,mol^{-1}})} {1.00\times10^{-3}\ \mathrm{L}} = 0.0195095\ \mathrm{mol\,L^{-1}}. \]
\(5\ \mathrm{mL}\) içinde eklenen miktar şöyledir:
\[ n_{\mathrm{EDTA,added}} =(0.005\ \mathrm{L})(0.0195095\ \mathrm{mol\,L^{-1}}) =9.75474\times10^{-5}\ \mathrm{mol}. \]
Geri titrasyon, tüketilmemiş EDTA'yı ölçer:
\[ \begin{aligned} n_{\mathrm{EDTA,excess}} &=n_{\mathrm{Ni,titrant}}\\ &=(0.09560\ \mathrm{L})(0.0010\ \mathrm{mol\,L^{-1}})\\ &=9.560\times10^{-5}\ \mathrm{mol}. \end{aligned} \]
Çıkarma işleminde ek basamaklar korunarak, atık sudan alınan alikottan geri kazanılan nikel miktarı şöyle bulunur:
\[ \begin{aligned} n_{\mathrm{Ni,sample}} &=n_{\mathrm{EDTA,added}}-n_{\mathrm{EDTA,excess}}\\ &=9.75474\times10^{-5}-9.560\times10^{-5}\\ &=1.9474\times10^{-6}\ \mathrm{mol}. \end{aligned} \]
Bu nikel, \(10\ \mathrm{mL}=0.010\ \mathrm{L}\) atık sudan gelmiştir. Bu nedenle,
\[ \begin{aligned} c_{\mathrm{mass}}(\ce{Ni^2+}) &=\frac{(1.9474\times10^{-6}\ \mathrm{mol}) (58.69\ \mathrm{g\,mol^{-1}}) (10^3\ \mathrm{mg\,g^{-1}})} {0.010\ \mathrm{L}}\\ &=11.429\ \mathrm{mg\,L^{-1}}. \end{aligned} \]
Böylece hesaplanan nominal sonuç,
\[ \boxed{c_{\mathrm{mass}}(\ce{Ni^2+})\approx11.4\ \mathrm{mg\,L^{-1}}}, \]
veya iki anlamlı rakamla yaklaşık \(11\ \mathrm{mg\,L^{-1}}\) olur.
100 mL'lik beher bir seyreltme faktörü getirmez: 10 mL'lik beş kısım birleştirilmiştir ve bunların 100 mL'ye seyreltilmesi yönünde bir talimat yoktur. Sonuç, birleştirilmiş atık su örneğini temsil eder.
9.8. Nikel sülfürün çökelmesi için en düşük pH
- adımda geri kazanılan nikel, \(10\ \mathrm{mL}\) içinde bulunur; dolayısıyla çökelmeden önceki derişimi şöyledir:
\[ [\ce{Ni^2+}] =\frac{1.9474\times10^{-6}\ \mathrm{mol}}{0.010\ \mathrm{L}} =1.9474\times10^{-4}\ \mathrm{mol\,L^{-1}}. \]
Kükürt türleri hidrojen sülfür, \(\ce{H2S}\), SMILES S; hidrosülfür iyonu, \(\ce{HS-}\), SMILES [SH-]; ve sülfür iyonu, \(\ce{S^2-}\), SMILES [S-2] şeklindedir.
Bunların asit ayrışma dengeleri şöyledir:
\[ \ce{H2S(aq) <=> H+(aq) + HS-(aq)} \]
ve
\[ \ce{HS-(aq) <=> H+(aq) + S^2-(aq)}. \]
İki denge ifadesi çarpıldığında,
\[ K_{\mathrm{a1}}K_{\mathrm{a2}} = \frac{[\ce{H+}]^2[\ce{S^2-}]}{[\ce{H2S}]}. \]
Dolayısıyla,
\[ [\ce{S^2-}] = \frac{K_{\mathrm{a1}}K_{\mathrm{a2}}[\ce{H2S}]} {[\ce{H+}]^2}. \]
Nikel(II) sülfürün, \(\ce{NiS}\), iyonik bileşenlerini gösteren SMILES ifadesi [Ni+2].[S-2] şeklindedir; çökelme tepkimesi ise şöyledir:
\[ \ce{Ni^2+(aq) + S^2-(aq) -> NiS(s)}. \]
Çökelmenin başladığı anda,
\[ [\ce{Ni^2+}][\ce{S^2-}]=K_{\mathrm{sp}}. \]
Böylece gerekli sülfür derişimi şöyledir:
\[ [\ce{S^2-}]_{\mathrm{crit}} = \frac{4.0\times10^{-20}}{1.9474\times10^{-4}} = 2.0540\times10^{-16}\ \mathrm{mol\,L^{-1}}. \]
Verilen doygunluk derişimi \([\ce{H2S}]=0.1\ \mathrm{M}\) kullanıldığında,
\[ \begin{aligned} [\ce{H+}] &= \sqrt{ \frac{K_{\mathrm{a1}}K_{\mathrm{a2}}[\ce{H2S}]} {[\ce{S^2-}]_{\mathrm{crit}}} }\\ &= \sqrt{ \frac{(9.6\times10^{-8})(1.3\times10^{-14})(0.1)} {2.0540\times10^{-16}} }\\ &=7.7948\times10^{-4}\ \mathrm{mol\,L^{-1}}. \end{aligned} \]
Sonuç olarak,
\[ \boxed{\mathrm{pH}_{\min} =-\log_{10}(7.7948\times10^{-4}) =3.108\approx3.11}. \]
pH'nın yükselmesi sülfür derişimini artırır; bu nedenle bu eşiğin üzerinde çökelme elverişli hâle gelir. Bakır sülfürün çözünürlük çarpımına gerek yoktur, çünkü 5. adım nikeli seçici olarak çözeltiye aktarır.
Çözüm, resmi çözümle karşılaştırılarak kontrol edildi. Bu çözümün resmi çözümden ayrıldığı yerlerde resmi çözümde bir hata ya da baskı hatası vardır.
IChO 2020 · Problema teórico 9
Cuantificación de iones de metales pesados
| 12% del total | Puntos | 5 | 5 | 8 | 16 | 5 | 6 | 25 | 30 | 100 |
Problema 9. Cuantificación de iones de metales pesados
Para el análisis cuantitativo de iones de metales pesados en una balsa de aguas residuales de una fábrica, un analista llevó a cabo los siguientes pasos a 298 K:
Paso 1) Se tomaron muestras de 10 mL de cada una de cinco zonas diferentes de una balsa de aguas residuales, se mezclaron en un vaso de precipitados de 100 mL y, a continuación, se agitaron durante 5 minutos con un agitador magnético.
Paso 2) Se tomaron 10 mL de la disolución de muestra del vaso de precipitados de 100 mL y se añadieron 142 mg de \(\ce{Na2SO4}\) mientras se agitaba; a continuación, se transfirió la disolución a una celda de tres electrodos, como se muestra en la Figura 1a. En esta celda electroquímica, un hilo de \(\ce{Pt}\), un electrodo de \(\ce{Ag/AgCl}\) (\(\ce{KCl}\) 3 M) y una lámina de \(\ce{Pt}\) actuaron como electrodo de trabajo, electrodo de referencia y contraelectrodo, respectivamente.
Paso 3) Estos electrodos se conectaron a un potenciostato y se aplicó un potencial constante de −0.50 V respecto a \(\ce{Ag/AgCl}\) durante 14 minutos, como se muestra en la Figura 1b (línea horizontal). Se supone que 14 min son suficientes para completar las reacciones electroquímicas previstas.
Figura 1. a) Diseño de la celda electroquímica; 1) electrodo de trabajo (hilo de \(\ce{Pt}\)), 2) electrodo de referencia (\(\ce{Ag/AgCl}\), \(\ce{KCl}\) 3M), 3) contraelectrodo (lámina de \(\ce{Pt}\)), 4) llave de la celda, 5) celda electroquímica, 6) 10 mL de la disolución de muestra. b) Variación del potencial del electrodo de trabajo en función del tiempo. Eje y: potencial/V respecto a \(\ce{Ag/AgCl}\), eje x: tiempo/min.
Paso 4) Los electrodos se enjuagaron con agua destilada, se colocaron en otra celda electroquímica que contenía 10 mL de una disolución de \(\ce{H2SO4}\) 0.1 M y se realizó un barrido de potencial entre −0.50 y +0.50 V, como se muestra en la Figura 1b (línea de pendiente descendente en 2 min). Los datos de corriente frente al potencial de este paso se presentan en la Figura 2a, que se asemeja a una magnífica vista del monte Ararat (Ağrı Dağı), la montaña más alta de Turquía (Figura 2b).
Figura 2. a) Barrido del potencial del electrodo de trabajo en función de la corriente en una disolución de \(\ce{H2SO4}\) 0.1 M, después de mantenerlo constante a un potencial de −0.50 V en 10 mL de muestra de aguas residuales, como se muestra en la Figura 1b (línea horizontal). Eje y: corriente/μA, eje x: potencial/V respecto a \(\ce{Ag/AgCl}\), b) Vista de las cumbres del Gran Ararat y el Pequeño Ararat.
Paso 5) Se tomaron otros 10 mL de la disolución de muestra preparada en el paso 1 y se aplicaron los procedimientos descritos en los pasos 2 y 3, en ese orden. Los electrodos se enjuagaron con agua destilada y se colocaron en 10 mL de una disolución de \(\ce{H2SO4}\) 0.1 M. A continuación, el potencial del electrodo de trabajo se mantuvo constante a +0.05 V durante 14 minutos. Se supone que 14 min son suficientes para completar las reacciones electroquímicas previstas.
Paso 6) Una vez realizado el paso 5, la disolución de la celda electroquímica se introdujo en una estufa adecuada para evaporarla a 150 °C hasta obtener un sólido seco.
Paso 7) Se añadieron 5 mL de una disolución de ácido etilendiaminotetraacético (EDTA, \(\ce{H4Y}\)) (Figura 3) al sólido obtenido en el paso 6 y se agitó para disolverlo. Se sabe que 1 mL de la disolución de EDTA equivale a 3.85 mg/mL de \(\ce{BaCO3}\). A continuación, se ajustó el pH de la disolución a 10.0. El exceso de EDTA se valoró con una disolución patrón de \(\ce{Ni(NO3)2}\) 0.0010 M y se observó que se consumieron 95.60 mL de la disolución de \(\ce{Ni(NO3)2}\) hasta el punto final.
Figura 3. Estructura química del EDTA (\(\ce{H4Y}\)).
- En agua saturada con \(\ce{H2S}\), la concentración de equilibrio de \([\ce{H2S}]\) es 0.1 M.
- \(K_{\mathrm{sp}}(\ce{NiS})=4.0\times10^{-20}\); \(K_{\mathrm{sp}}(\ce{CuS})=1.0\times10^{-36}\)
- \(K_{\mathrm{a1}}(\ce{H2S})=9.6\times10^{-8}\); \(K_{\mathrm{a2}}(\ce{H2S})=1.3\times10^{-14}\)
| Reacción | \(E^\circ/\mathrm{V}\) (a 298 K) |
|---|---|
| \(\ce{2H2O(l) + 2e- -> H2(g) + 2OH-(aq)}\) | −0.83 |
| \(\ce{Ni^2+(aq) + 2e- -> Ni(s)}\) | −0.24 |
| \(\ce{2H+(aq) + 2e- -> H2(g)}\) | 0.00 |
| \(\ce{Cu^2+(aq) + 2e- -> Cu(s)}\) | +0.34 |
| \(\ce{Ag+(aq) + e- -> Ag(s)}\) | +0.80 |
| \(\ce{O2(g) + 4H+(aq) + 4e- -> 2H2O(l)}\) | +1.23 |
9.1. ¿Cuál de las siguientes opciones corresponde a los picos 1 y 2 de la Figura 2a, respectivamente? Marque la casilla correcta en la hoja de respuestas.
- ☐ Pico 1: reducción electroquímica de \(\ce{Ni}\) / Pico 2: reducción electroquímica de \(\ce{Cu}\)
- ☐ Pico 1: reducción electroquímica de \(\ce{Cu}\) / Pico 2: reducción electroquímica de \(\ce{Ni}\)
- ☐ Pico 1: reducción electroquímica de \(\ce{Ni}\) / Pico 2: oxidación electroquímica de \(\ce{Cu}\)
- ☐ Pico 1: oxidación electroquímica de \(\ce{Ni}\) / Pico 2: oxidación electroquímica de \(\ce{Cu}\)
- ☐ Pico 1: oxidación electroquímica de \(\ce{Cu}\) / Pico 2: oxidación electroquímica de \(\ce{Ni}\)
9.2. ¿Cuál de los siguientes fenómenos se espera si se aplica un potencial de −1.2 V en lugar de -0.5 V en la primera etapa (línea horizontal) de la Figura 1b? Marque la casilla correcta en la hoja de respuestas.
- ☐ Desprendimiento de \(\ce{NO}\)
- ☐ Desprendimiento de \(\ce{NO2}\)
- ☐ Desprendimiento de nitrógeno
- ☐ Desprendimiento de oxígeno
- ☐ Desprendimiento de hidrógeno
9.3. Calcule la velocidad de barrido de los datos presentados en la Figura 2a, en mV/s, a 298 K.
El potencial medido de la siguiente celda es 0.437 V.
\[ \ce{Pt},\ce{H2}(0.92\ \mathrm{bar}) \mid \ce{HCl}(1.50\times10^{-2}\ \mathrm{M}),\ce{AgCl}(sat) \mid\ce{Ag} \]
9.4. Calcule el valor del potencial estándar de electrodo (V) de la semicelda \(\ce{AgCl(s) + e- -> Ag(s) + Cl-(aq)}\) a 298 K. Nota: Debe mostrar todos los cálculos.
9.5. ¿Cuál de las siguientes opciones describe el objetivo principal del paso 5 en este análisis? Marque la casilla correcta en la hoja de respuestas.
- ☐ Modificación del hilo de \(\ce{Pt}\) con una película de aleación de \(\ce{Ni}\)–\(\ce{Cu}\)
- ☐ Modificación del hilo de \(\ce{Pt}\) con una película de \(\ce{Ni}\)
- ☐ Redisolución electroquímica tanto del \(\ce{Cu}\) como del \(\ce{Ni}\) desde el hilo de \(\ce{Pt}\) modificado con \(\ce{Cu}\)–\(\ce{Ni}\) hacia la disolución
- ☐ Redisolución electroquímica del \(\ce{Cu}\) desde el hilo de \(\ce{Pt}\) modificado con \(\ce{Cu}\)–\(\ce{Ni}\) hacia la disolución
- ☐ Redisolución electroquímica del \(\ce{Ni}\) desde el hilo de \(\ce{Pt}\) modificado con \(\ce{Cu}\)–\(\ce{Ni}\) hacia la disolución
9.6. Escriba en la hoja de respuestas las ecuaciones iónicas netas de la complejación y de la reacción de valoración por retroceso del paso 7
9.7. Calcule la concentración de \(\ce{Ni^2+}\) en mg/L en las aguas residuales de la fábrica. Nota: Debe mostrar todos los cálculos.
9.8. Calcule el valor mínimo del pH para que comience la precipitación de los iones \(\ce{Ni^2+}\) en la disolución obtenida en el paso 5, haciendo pasar \(\ce{H2S}\) gaseoso por la disolución hasta saturarla. Si no puede resolver la pregunta 9.7, utilice para esta pregunta una muestra de \(\ce{Ni^2+}\) de 20 mg/L. Nota: Debe mostrar todos los cálculos.
Enunciado traducido del texto oficial en inglés.
Respuestas
- 9.1. Cuarta casilla: el pico 1 corresponde a la oxidación del níquel; el pico 2, a la oxidación del cobre.
- 9.2. Quinta casilla: desprendimiento de hidrógeno, \(\ce{H2}\), SMILES
[H][H]. - 9.3. \(\boxed{v=+8.33\ \mathrm{mV\,s^{-1}}}\).
- 9.4. \(\boxed{E^\circ_{\ce{AgCl/Ag}}=+0.222\ \mathrm{V}}\), respecto al electrodo estándar de hidrógeno.
- 9.5. Quinta casilla: redisolución electroquímica selectiva del níquel del depósito de cobre–níquel hacia la disolución.
- 9.6. Complejación: \(\ce{Ni^2+ + H4Y -> [NiY]^2- + 4H+}\). Valoración por retroceso, utilizando la notación del EDTA completamente desprotonado: \(\ce{Ni^2+ + Y^4- -> [NiY]^2-}\). Los nombres de las especies y sus SMILES se indican más adelante.
- 9.7. \(\boxed{c_{\mathrm{mass}}(\ce{Ni^2+})\approx11.4\ \mathrm{mg\,L^{-1}}}\), o aproximadamente \(11\ \mathrm{mg\,L^{-1}}\) con dos cifras significativas.
- 9.8. \(\boxed{\mathrm{pH}_{\min}\approx3.11}\).
Solución
9.1. Identificación de los picos de redisolución
Durante la etapa de deposición, los iones níquel(II), \(\ce{Ni^2+}\), SMILES [Ni+2], y los iones cobre(II), \(\ce{Cu^2+}\), SMILES [Cu+2], se reducen sobre el electrodo de trabajo:
\[ \ce{Ni^2+(aq) + 2e- -> Ni(s)} \] \[ \ce{Cu^2+(aq) + 2e- -> Cu(s)} \]
El barrido posterior va de −0.50 a +0.50 V: avanza hacia un potencial más positivo, pese al aspecto descendente de la línea en la Figura 1b. Por tanto, los metales depositados se oxidan y se redisuelven en la disolución.
El níquel tiene el menor potencial estándar de reducción:
\[ E^\circ_{\ce{Ni^2+/Ni}}=-0.24\ \mathrm{V} < E^\circ_{\ce{Cu^2+/Cu}}=+0.34\ \mathrm{V}. \]
En consecuencia, el níquel se oxida en el primer pico de redisolución, menos positivo, seguido del cobre:
\[ \text{Pico 1:}\qquad \ce{Ni(s) -> Ni^2+(aq) + 2e-} \] \[ \text{Pico 2:}\qquad \ce{Cu(s) -> Cu^2+(aq) + 2e-}. \]
Por tanto, marque la cuarta casilla.
9.2. Efecto de aplicar −1.2 V
El potencial mucho más negativo del electrodo de trabajo favorece la reducción del agua y el desprendimiento de hidrógeno:
\[ \ce{2H2O(l) + 2e- -> H2(g) + 2OH-(aq)}. \]
Las especies son agua, SMILES O; hidrógeno, SMILES [H][H]; e ion hidróxido, SMILES [OH-].
Por tanto, marque la quinta casilla: desprendimiento de hidrógeno.
9.3. Velocidad de barrido
El potencial varía \(1.00\ \mathrm{V}\) en \(2\ \mathrm{min}=120\ \mathrm{s}\):
\[ v=\frac{\Delta E}{\Delta t} =\frac{(+0.50)-(-0.50)}{120} =8.333\times10^{-3}\ \mathrm{V\,s^{-1}}. \]
Por tanto,
\[ \boxed{v=+8.33\ \mathrm{mV\,s^{-1}}}. \]
El signo positivo indica que el potencial aumenta.
9.4. Potencial estándar del electrodo de plata/cloruro de plata
El ácido clorhídrico aporta iones hidrógeno, \(\ce{H+}\), SMILES [H+], e iones cloruro, \(\ce{Cl-}\), SMILES [Cl-]. El cloruro de plata(I) tiene el SMILES de componentes iónicos [Ag+].[Cl-]; este especifica sus constituyentes, no su red cristalina.
En el electrodo de la izquierda tiene lugar la oxidación:
\[ \ce{H2(g) -> 2H+(aq) + 2e-}. \]
En el electrodo de la derecha tiene lugar la reducción:
\[ \ce{2AgCl(s) + 2e- -> 2Ag(s) + 2Cl-(aq)}. \]
Por tanto, la reacción global de la celda es
\[ \ce{H2(g) + 2AgCl(s) -> 2H+(aq) + 2Ag(s) + 2Cl-(aq)}. \]
Se transfieren dos electrones, y el cociente de reacción es
\[ Q=\frac{a_{\ce{H+}}^2a_{\ce{Cl-}}^2} {p_{\ce{H2}}/p^\circ}. \]
Tomando las actividades en disolución como las concentraciones divididas por la concentración estándar, y despreciando la pequeña contribución de cloruro procedente del cloruro de plata disuelto,
\[ a_{\ce{H+}}=a_{\ce{Cl-}}=1.50\times10^{-2}, \qquad \frac{p_{\ce{H2}}}{p^\circ}=0.92. \]
Así,
\[ Q=\frac{(1.50\times10^{-2})^4}{0.92} =5.5027\times10^{-8}. \]
Como el electrodo estándar de hidrógeno tiene \(E^\circ=0\),
\[ E^\circ_{\mathrm{cell}}=E^\circ_{\ce{AgCl/Ag}}. \]
La ecuación de Nernst da
\[ E_{\mathrm{cell}} =E^\circ_{\mathrm{cell}}-\frac{RT}{2F}\ln Q, \]
por lo que, utilizando \(R=8.314\ \mathrm{J\,mol^{-1}\,K^{-1}}\) y \(F=96485\ \mathrm{C\,mol^{-1}}\),
\[ \begin{aligned} E^\circ_{\ce{AgCl/Ag}} &=0.437+ \frac{(8.314)(298)}{2(96485)} \ln(5.5027\times10^{-8})\\ &=0.437-0.2146\\ &=0.2224\ \mathrm{V}. \end{aligned} \]
Por tanto,
\[ \boxed{E^\circ_{\ce{AgCl/Ag}}=+0.222\ \mathrm{V}\text{ respecto a SHE}}. \]
9.5. Objetivo del paso 5
En la Figura 2a, +0.05 V se sitúa después del pico de redisolución del níquel y antes del pico de redisolución del cobre. Mantener el electrodo a este potencial oxida selectivamente el níquel depositado:
\[ \ce{Ni(s) -> Ni^2+(aq) + 2e-}. \]
Bajo el supuesto de reacción completa indicado en el problema, el níquel pasa a la nueva disolución ácida mientras que el cobre permanece en el electrodo. Esto separa el níquel para su posterior determinación.
Por tanto, marque la quinta casilla.
9.6. Ecuaciones de complejación y valoración por retroceso
El ligando y el complejo son:
- Ácido etilendiaminotetraacético, \(\ce{H4Y}\):
O=C(O)CN(CC(=O)O)CCN(CC(=O)O)CC(=O)O - Ion etilendiaminotetraacetato, \(\ce{Y^4-}\):
O=C([O-])CN(CC(=O)[O-])CCN(CC(=O)[O-])CC(=O)[O-] - Complejo de níquel(II)–EDTA, \(\ce{[NiY]^2-}\), utilizando SMILES con enlaces dativos:
[Ni+2]12345<-N(CC(=O)[O-]->1)(CC(=O)[O-]->2)CCN->3(CC(=O)[O-]->4)CC(=O)[O-]->5
El EDTA se coordina a través de sus dos átomos de nitrógeno amínicos y de un átomo de oxígeno de cada uno de sus cuatro grupos carboxilato. Esto da lugar a un entorno de coordinación del níquel aproximadamente octaédrico. El SMILES especifica la conectividad de los átomos donadores; no se selecciona ningún estereoisómero de coordinación ni ninguna conformación en particular.
Para la complejación del níquel de la muestra, escrita con el ácido especificado en el problema,
\[ \boxed{\ce{Ni^2+(aq) + H4Y(aq) -> [NiY]^2-(aq) + 4H+(aq)}}. \]
Para la valoración por retroceso del exceso de EDTA, escrita utilizando el ligando completamente desprotonado,
\[ \boxed{\ce{Ni^2+(aq) + Y^4-(aq) -> [NiY]^2-(aq)}}. \]
Estas son convenciones alternativas de protonación para la misma formación de complejo subyacente. La segunda ecuación no exige que todo el EDTA no complejado exista como \(\ce{Y^4-}\) a pH 10; los equilibrios de protonación acompañan a la complejación.
Es fundamental que un mol de níquel(II) consume un mol de EDTA en ambas etapas.
9.7. Concentración de níquel en las aguas residuales
La estandarización del EDTA se interpreta como \(3.85\ \mathrm{mg}\) de carbonato de bario equivalente por mililitro de disolución de EDTA.
El carbonato de bario, \(\ce{BaCO3}\), tiene el SMILES de componentes iónicos [Ba+2].[O-]C(=O)[O-]. Cada mol contiene un mol de ion bario(II), [Ba+2], que corresponde a un mol de EDTA en un complejo metal–EDTA 1:1.
Utilizando
\[ M(\ce{BaCO3})=197.34\ \mathrm{g\,mol^{-1}}, \qquad M(\ce{Ni})=58.69\ \mathrm{g\,mol^{-1}}, \]
la concentración de EDTA es
\[ c_{\mathrm{EDTA}} = \frac{3.85\times10^{-3}\ \mathrm{g}/ (197.34\ \mathrm{g\,mol^{-1}})} {1.00\times10^{-3}\ \mathrm{L}} = 0.0195095\ \mathrm{mol\,L^{-1}}. \]
La cantidad añadida en \(5\ \mathrm{mL}\) es
\[ n_{\mathrm{EDTA,added}} =(0.005\ \mathrm{L})(0.0195095\ \mathrm{mol\,L^{-1}}) =9.75474\times10^{-5}\ \mathrm{mol}. \]
La valoración por retroceso mide el EDTA no consumido:
\[ \begin{aligned} n_{\mathrm{EDTA,excess}} &=n_{\mathrm{Ni,titrant}}\\ &=(0.09560\ \mathrm{L})(0.0010\ \mathrm{mol\,L^{-1}})\\ &=9.560\times10^{-5}\ \mathrm{mol}. \end{aligned} \]
Conservando cifras de guarda en la resta, la cantidad de níquel recuperada de la alícuota de aguas residuales es
\[ \begin{aligned} n_{\mathrm{Ni,sample}} &=n_{\mathrm{EDTA,added}}-n_{\mathrm{EDTA,excess}}\\ &=9.75474\times10^{-5}-9.560\times10^{-5}\\ &=1.9474\times10^{-6}\ \mathrm{mol}. \end{aligned} \]
Este níquel procedía de \(10\ \mathrm{mL}=0.010\ \mathrm{L}\) de aguas residuales. Por tanto,
\[ \begin{aligned} c_{\mathrm{mass}}(\ce{Ni^2+}) &=\frac{(1.9474\times10^{-6}\ \mathrm{mol}) (58.69\ \mathrm{g\,mol^{-1}}) (10^3\ \mathrm{mg\,g^{-1}})} {0.010\ \mathrm{L}}\\ &=11.429\ \mathrm{mg\,L^{-1}}. \end{aligned} \]
Así, el resultado nominal calculado es
\[ \boxed{c_{\mathrm{mass}}(\ce{Ni^2+})\approx11.4\ \mathrm{mg\,L^{-1}}}, \]
o aproximadamente \(11\ \mathrm{mg\,L^{-1}}\) con dos cifras significativas.
El vaso de precipitados de 100 mL no introduce un factor de dilución: se mezclaron cinco porciones de 10 mL, sin indicación de diluirlas hasta 100 mL. El resultado representa la muestra combinada de aguas residuales.
9.8. pH mínimo para la precipitación del sulfuro de níquel
El níquel recuperado en el paso 5 está contenido en \(10\ \mathrm{mL}\), por lo que su concentración antes de la precipitación es
\[ [\ce{Ni^2+}] =\frac{1.9474\times10^{-6}\ \mathrm{mol}}{0.010\ \mathrm{L}} =1.9474\times10^{-4}\ \mathrm{mol\,L^{-1}}. \]
Las especies de azufre son sulfuro de hidrógeno, \(\ce{H2S}\), SMILES S; ion hidrogenosulfuro, \(\ce{HS-}\), SMILES [SH-]; e ion sulfuro, \(\ce{S^2-}\), SMILES [S-2].
Sus equilibrios de disociación ácida son
\[ \ce{H2S(aq) <=> H+(aq) + HS-(aq)} \]
y
\[ \ce{HS-(aq) <=> H+(aq) + S^2-(aq)}. \]
Al multiplicar las dos expresiones de equilibrio se obtiene
\[ K_{\mathrm{a1}}K_{\mathrm{a2}} = \frac{[\ce{H+}]^2[\ce{S^2-}]}{[\ce{H2S}]}. \]
Por tanto,
\[ [\ce{S^2-}] = \frac{K_{\mathrm{a1}}K_{\mathrm{a2}}[\ce{H2S}]} {[\ce{H+}]^2}. \]
El sulfuro de níquel(II), \(\ce{NiS}\), tiene el SMILES de componentes iónicos [Ni+2].[S-2]; su reacción de precipitación es
\[ \ce{Ni^2+(aq) + S^2-(aq) -> NiS(s)}. \]
Al inicio de la precipitación,
\[ [\ce{Ni^2+}][\ce{S^2-}]=K_{\mathrm{sp}}. \]
Así, la concentración de sulfuro necesaria es
\[ [\ce{S^2-}]_{\mathrm{crit}} = \frac{4.0\times10^{-20}}{1.9474\times10^{-4}} = 2.0540\times10^{-16}\ \mathrm{mol\,L^{-1}}. \]
Utilizando la concentración de saturación especificada, \([\ce{H2S}]=0.1\ \mathrm{M}\),
\[ \begin{aligned} [\ce{H+}] &= \sqrt{ \frac{K_{\mathrm{a1}}K_{\mathrm{a2}}[\ce{H2S}]} {[\ce{S^2-}]_{\mathrm{crit}}} }\\ &= \sqrt{ \frac{(9.6\times10^{-8})(1.3\times10^{-14})(0.1)} {2.0540\times10^{-16}} }\\ &=7.7948\times10^{-4}\ \mathrm{mol\,L^{-1}}. \end{aligned} \]
En consecuencia,
\[ \boxed{\mathrm{pH}_{\min} =-\log_{10}(7.7948\times10^{-4}) =3.108\approx3.11}. \]
Al aumentar el pH, aumenta la concentración de sulfuro, por lo que la precipitación se vuelve favorable por encima de este umbral. El producto de solubilidad del sulfuro de cobre es innecesario porque el paso 5 transfiere selectivamente el níquel a la disolución.
La solución se comprobó con la solución oficial. Donde esta solución difiere de la solución oficial, la solución oficial contiene un error o una errata.
IChO 2020 · 理论题 9
重金属离子的定量测定
| 占总分的 12% | 分值 | 5 | 5 | 8 | 16 | 5 | 6 | 25 | 30 | 100 |
题目 9. 重金属离子的定量测定
为对某工厂废水池中的重金属离子进行定量分析,一位分析人员在 298 K 下进行了以下操作:
步骤 1) 从废水池的五个不同区域各取 10 mL 样品,在一个 100 mL 烧杯中混合,然后用磁力搅拌器搅拌 5 分钟。
步骤 2) 从该 100 mL 烧杯中取出 10 mL 样品溶液,在搅拌的同时加入 142 mg \(\ce{Na2SO4}\),然后转移至图 1a 所示的三电极电解池中。在该电化学池中,\(\ce{Pt}\) 丝、\(\ce{Ag/AgCl}\)(3 M \(\ce{KCl}\))和 \(\ce{Pt}\) 箔分别用作工作电极、参比电极和对电极。
步骤 3) 将这些电极连接至恒电位仪,以 \(\ce{Ag/AgCl}\) 为参比,施加 −0.50 V 的恒定电位,持续 14 分钟,如图 1b 所示(水平线)。假定 14 分钟足以使预期的电化学反应完全进行。
图 1. a) 电化学池的结构;1) 工作电极(\(\ce{Pt}\) 丝),2) 参比电极(\(\ce{Ag/AgCl}\),3M \(\ce{KCl}\)),3) 对电极(\(\ce{Pt}\) 箔),4) 池体活塞,5) 电化学池,6) 10 mL 样品溶液。b) 工作电极电位随时间的变化。y 轴:电位/V(相对于 \(\ce{Ag/AgCl}\)),x 轴:时间/min。
步骤 4) 用蒸馏水冲洗电极,将其放入另一个含有 10 mL 0.1 M \(\ce{H2SO4}\) 溶液的电化学池中,在 −0.50 至 +0.50 V 之间扫描电位,如图 1b 所示(2 分钟内向下倾斜的线)。本步骤的电流–电位数据如图 2a 所示,其形状宛如土耳其最高山峰——阿拉拉特山(Ağrı Dağı)的壮丽景色(图 2b)。
图 2. a) 将工作电极在 10 mL 废水样品中保持于 −0.50 V 的恒定电位(如图 1b 中的水平线所示)后,在 0.1 M \(\ce{H2SO4}\) 溶液中进行电位扫描所得的电位与电流关系。y 轴:电流/μA,x 轴:电位/V(相对于 \(\ce{Ag/AgCl}\)),b) 大阿拉拉特山和小阿拉拉特山山峰的景色。
步骤 5) 另取 10 mL 在步骤 1 中制备的样品溶液,依次进行步骤 2 和 3 中所述的操作。用蒸馏水冲洗电极,并将其放入 10 mL 0.1 M \(\ce{H2SO4}\) 溶液中。随后将工作电极的电位恒定在 +0.05 V,持续 14 分钟。假定 14 分钟足以使预期的电化学反应完全进行。
步骤 6) 完成步骤 5 后,将电化学池中的溶液置于适当的烘箱中,在 150 °C 下蒸发,直至得到干燥固体。
步骤 7) 向步骤 6 中得到的固体加入 5 mL 乙二胺四乙酸(EDTA,\(\ce{H4Y}\))(图 3)溶液,振荡使其溶解。已知 1 mL EDTA 溶液相当于 3.85 mg/mL 的 \(\ce{BaCO3}\)。然后将溶液的 pH 调至 10.0。用标准 0.0010 M \(\ce{Ni(NO3)2}\) 溶液滴定过量的 EDTA,观察到达到终点时消耗了 95.60 mL \(\ce{Ni(NO3)2}\) 溶液。
图 3. EDTA(\(\ce{H4Y}\))的化学结构。
- 在 \(\ce{H2S}\) 饱和的水中,\([\ce{H2S}]\) 的平衡浓度为 0.1 M。
- \(K_{\mathrm{sp}}(\ce{NiS})=4.0\times10^{-20}\); \(K_{\mathrm{sp}}(\ce{CuS})=1.0\times10^{-36}\)
- \(K_{\mathrm{a1}}(\ce{H2S})=9.6\times10^{-8}\); \(K_{\mathrm{a2}}(\ce{H2S})=1.3\times10^{-14}\)
| 反应 | \(E^\circ/\mathrm{V}\)(298 K 时) |
|---|---|
| \(\ce{2H2O(l) + 2e- -> H2(g) + 2OH-(aq)}\) | −0.83 |
| \(\ce{Ni^2+(aq) + 2e- -> Ni(s)}\) | −0.24 |
| \(\ce{2H+(aq) + 2e- -> H2(g)}\) | 0.00 |
| \(\ce{Cu^2+(aq) + 2e- -> Cu(s)}\) | +0.34 |
| \(\ce{Ag+(aq) + e- -> Ag(s)}\) | +0.80 |
| \(\ce{O2(g) + 4H+(aq) + 4e- -> 2H2O(l)}\) | +1.23 |
9.1. 图 2a 中的峰 1 和峰 2 分别对应以下哪一项?在答题纸的正确方框中打勾。
- ☐ 峰 1:\(\ce{Ni}\) 的电化学还原 / 峰 2:\(\ce{Cu}\) 的电化学还原
- ☐ 峰 1:\(\ce{Cu}\) 的电化学还原 / 峰 2:\(\ce{Ni}\) 的电化学还原
- ☐ 峰 1:\(\ce{Ni}\) 的电化学还原 / 峰 2:\(\ce{Cu}\) 的电化学氧化
- ☐ 峰 1:\(\ce{Ni}\) 的电化学氧化 / 峰 2:\(\ce{Cu}\) 的电化学氧化
- ☐ 峰 1:\(\ce{Cu}\) 的电化学氧化 / 峰 2:\(\ce{Ni}\) 的电化学氧化
9.2. 如果在图 1b 的第一阶段(水平线)施加的电位为 −1.2 V 而非 -0.5 V,预期会发生以下哪种情况?在答题纸的正确方框中打勾。
- ☐ 析出 \(\ce{NO}\)
- ☐ 析出 \(\ce{NO2}\)
- ☐ 析出氮气
- ☐ 析出氧气
- ☐ 析出氢气
9.3. 计算图 2a 所示数据在 298 K 下的扫描速率,以 mV/s 为单位。
测得下列电池的电动势为 0.437 V。
\[ \ce{Pt},\ce{H2}(0.92\ \mathrm{bar}) \mid \ce{HCl}(1.50\times10^{-2}\ \mathrm{M}),\ce{AgCl}(sat) \mid\ce{Ag} \]
9.4. 计算半电池 \(\ce{AgCl(s) + e- -> Ag(s) + Cl-(aq)}\) 在 298 K 下的标准电极电位值(V)。注意:必须写出全部计算过程。
9.5. 下列哪一项是本分析中步骤 5 的主要目的?在答题纸的正确方框中打勾。
- ☐ 用 \(\ce{Ni}\)–\(\ce{Cu}\) 合金膜修饰 \(\ce{Pt}\) 丝
- ☐ 用 \(\ce{Ni}\) 膜修饰 \(\ce{Pt}\) 丝
- ☐ 将 \(\ce{Cu}\) 和 \(\ce{Ni}\) 从 \(\ce{Cu}\)–\(\ce{Ni}\) 修饰的 \(\ce{Pt}\) 丝上电化学溶出至溶液中
- ☐ 将 \(\ce{Cu}\) 从 \(\ce{Cu}\)–\(\ce{Ni}\) 修饰的 \(\ce{Pt}\) 丝上电化学溶出至溶液中
- ☐ 将 \(\ce{Ni}\) 从 \(\ce{Cu}\)–\(\ce{Ni}\) 修饰的 \(\ce{Pt}\) 丝上电化学溶出至溶液中
9.6. 在答题纸上写出步骤 7 中配位反应和返滴定反应的净离子方程式。
9.7. 计算该工厂废水中 \(\ce{Ni^2+}\) 的浓度,以 mg/L 为单位。注意:必须写出全部计算过程。
9.8. 向步骤 5 所得溶液中通入 \(\ce{H2S}\) 气体直至饱和,计算溶液中 \(\ce{Ni^2+}\) 离子开始沉淀所需的最低 pH 值。如果你无法解答 9.7,本题可使用 20 mg/L 的 \(\ce{Ni^2+}\) 样品进行计算。注意:必须写出全部计算过程。
题目译自官方英文原文。
答案
- 9.1. 第四个方框:峰 1 为镍的氧化;峰 2 为铜的氧化。
- 9.2. 第五个方框:析出氢气,\(\ce{H2}\),SMILES
[H][H]。 - 9.3. \(\boxed{v=+8.33\ \mathrm{mV\,s^{-1}}}\)。
- 9.4. \(\boxed{E^\circ_{\ce{AgCl/Ag}}=+0.222\ \mathrm{V}}\),相对于标准氢电极。
- 9.5. 第五个方框:将镍从铜–镍沉积层中选择性地电化学溶出至溶液中。
- 9.6. 配位反应:\(\ce{Ni^2+ + H4Y -> [NiY]^2- + 4H+}\)。返滴定反应,采用完全去质子化的 EDTA 表示:\(\ce{Ni^2+ + Y^4- -> [NiY]^2-}\)。各物种的名称和 SMILES 见下文。
- 9.7. \(\boxed{c_{\mathrm{mass}}(\ce{Ni^2+})\approx11.4\ \mathrm{mg\,L^{-1}}}\),或保留两位有效数字时约为 \(11\ \mathrm{mg\,L^{-1}}\)。
- 9.8. \(\boxed{\mathrm{pH}_{\min}\approx3.11}\)。
解答
9.1. 溶出峰的归属
在沉积步骤中,镍(II)离子 \(\ce{Ni^2+}\)(SMILES [Ni+2])和铜(II)离子 \(\ce{Cu^2+}\)(SMILES [Cu+2])在工作电极上被还原并沉积:
\[ \ce{Ni^2+(aq) + 2e- -> Ni(s)} \] \[ \ce{Cu^2+(aq) + 2e- -> Cu(s)} \]
随后的扫描从 −0.50 V 进行至 +0.50 V:尽管图 1b 中的线看起来向下倾斜,扫描方向实际上是朝向更正的电位。因此,沉积的金属被氧化并溶出至溶液中。
镍的标准还原电位较低:
\[ E^\circ_{\ce{Ni^2+/Ni}}=-0.24\ \mathrm{V} < E^\circ_{\ce{Cu^2+/Cu}}=+0.34\ \mathrm{V}. \]
因此,镍在较早出现、电位较低的溶出峰处被氧化,随后是铜:
\[ \text{峰 1:}\qquad \ce{Ni(s) -> Ni^2+(aq) + 2e-} \] \[ \text{峰 2:}\qquad \ce{Cu(s) -> Cu^2+(aq) + 2e-}. \]
因此,在第四个方框中打勾。
9.2. 施加 −1.2 V 电位的影响
负得多的工作电极电位会促进水的还原和氢气的析出:
\[ \ce{2H2O(l) + 2e- -> H2(g) + 2OH-(aq)}. \]
这些物种分别为水,SMILES O;氢气,SMILES [H][H];以及氢氧根离子,SMILES [OH-]。
因此,在第五个方框中打勾:析出氢气。
9.3. 扫描速率
电位在 \(2\ \mathrm{min}=120\ \mathrm{s}\) 内变化了 \(1.00\ \mathrm{V}\):
\[ v=\frac{\Delta E}{\Delta t} =\frac{(+0.50)-(-0.50)}{120} =8.333\times10^{-3}\ \mathrm{V\,s^{-1}}. \]
因此,
\[ \boxed{v=+8.33\ \mathrm{mV\,s^{-1}}}. \]
正号表示电位升高。
9.4. 银/氯化银电极的标准电位
盐酸提供氢离子 \(\ce{H+}\)(SMILES [H+])和氯离子 \(\ce{Cl-}\)(SMILES [Cl-])。氯化银(I)的离子组分 SMILES 为 [Ag+].[Cl-];它表示其组成离子,而非其晶格。
左侧电极发生氧化反应:
\[ \ce{H2(g) -> 2H+(aq) + 2e-}. \]
右侧电极发生还原反应:
\[ \ce{2AgCl(s) + 2e- -> 2Ag(s) + 2Cl-(aq)}. \]
因此,电池总反应为
\[ \ce{H2(g) + 2AgCl(s) -> 2H+(aq) + 2Ag(s) + 2Cl-(aq)}. \]
反应转移两个电子,反应商为
\[ Q=\frac{a_{\ce{H+}}^2a_{\ce{Cl-}}^2} {p_{\ce{H2}}/p^\circ}. \]
将溶液中各物种的活度近似为其浓度除以标准浓度,并忽略氯化银溶解所贡献的少量氯离子,
\[ a_{\ce{H+}}=a_{\ce{Cl-}}=1.50\times10^{-2}, \qquad \frac{p_{\ce{H2}}}{p^\circ}=0.92. \]
于是,
\[ Q=\frac{(1.50\times10^{-2})^4}{0.92} =5.5027\times10^{-8}. \]
由于标准氢电极的 \(E^\circ=0\),
\[ E^\circ_{\mathrm{cell}}=E^\circ_{\ce{AgCl/Ag}}. \]
由能斯特方程可得
\[ E_{\mathrm{cell}} =E^\circ_{\mathrm{cell}}-\frac{RT}{2F}\ln Q, \]
因此,取 \(R=8.314\ \mathrm{J\,mol^{-1}\,K^{-1}}\) 和 \(F=96485\ \mathrm{C\,mol^{-1}}\),
\[ \begin{aligned} E^\circ_{\ce{AgCl/Ag}} &=0.437+ \frac{(8.314)(298)}{2(96485)} \ln(5.5027\times10^{-8})\\ &=0.437-0.2146\\ &=0.2224\ \mathrm{V}. \end{aligned} \]
因此,
\[ \boxed{E^\circ_{\ce{AgCl/Ag}}=+0.222\ \mathrm{V}\text{ 相对于 SHE}}. \]
9.5. 步骤 5 的目的
在图 2a 中,+0.05 V 位于镍的溶出峰之后、铜的溶出峰之前。将电极保持在这一电位,可选择性地氧化沉积的镍:
\[ \ce{Ni(s) -> Ni^2+(aq) + 2e-}. \]
根据题目所给反应完全进行的假设,镍被转移至新配的酸溶液中,而铜仍留在电极上。这样便将镍分离出来,以供后续测定。
因此,在第五个方框中打勾。
9.6. 配位反应与返滴定反应的方程式
配体及配合物如下:
- 乙二胺四乙酸,\(\ce{H4Y}\):
O=C(O)CN(CC(=O)O)CCN(CC(=O)O)CC(=O)O - 乙二胺四乙酸根离子,\(\ce{Y^4-}\):
O=C([O-])CN(CC(=O)[O-])CCN(CC(=O)[O-])CC(=O)[O-] - 镍(II)–EDTA 配合物,\(\ce{[NiY]^2-}\),采用含配位键的 SMILES:
[Ni+2]12345<-N(CC(=O)[O-]->1)(CC(=O)[O-]->2)CCN->3(CC(=O)[O-]->4)CC(=O)[O-]->5
EDTA 通过两个胺氮原子以及四个羧酸根基团各自的一个氧原子参与配位。这使镍周围形成近似八面体的配位环境。该 SMILES 表示配位原子的连接关系;并未指定某一种配位立体异构体或构象。
对于样品中镍的配位反应,采用题目指定的酸形式书写,
\[ \boxed{\ce{Ni^2+(aq) + H4Y(aq) -> [NiY]^2-(aq) + 4H+(aq)}}. \]
对于过量 EDTA 的返滴定反应,采用完全去质子化的配体形式书写,
\[ \boxed{\ce{Ni^2+(aq) + Y^4-(aq) -> [NiY]^2-(aq)}}. \]
这两种写法采用了不同的质子化形式,描述的本质上是同一个配合物形成过程。第二个方程式并不要求在 pH 10 时所有未配位的 EDTA 均以 \(\ce{Y^4-}\) 的形式存在;配位过程伴随着质子化平衡。
关键在于,在这两个阶段中,一摩尔镍(II)均消耗一摩尔 EDTA。
9.7. 废水中的镍浓度
将 EDTA 的标定结果理解为每毫升 EDTA 溶液相当于 \(3.85\ \mathrm{mg}\) 碳酸钡。
碳酸钡 \(\ce{BaCO3}\) 的离子组分 SMILES 为 [Ba+2].[O-]C(=O)[O-]。每摩尔碳酸钡含有一摩尔钡(II)离子 [Ba+2],在 1:1 的金属–EDTA 配合物中对应一摩尔 EDTA。
采用
\[ M(\ce{BaCO3})=197.34\ \mathrm{g\,mol^{-1}}, \qquad M(\ce{Ni})=58.69\ \mathrm{g\,mol^{-1}}, \]
可得 EDTA 的浓度为
\[ c_{\mathrm{EDTA}} = \frac{3.85\times10^{-3}\ \mathrm{g}/ (197.34\ \mathrm{g\,mol^{-1}})} {1.00\times10^{-3}\ \mathrm{L}} = 0.0195095\ \mathrm{mol\,L^{-1}}. \]
加入的 \(5\ \mathrm{mL}\) 溶液中 EDTA 的物质的量为
\[ n_{\mathrm{EDTA,added}} =(0.005\ \mathrm{L})(0.0195095\ \mathrm{mol\,L^{-1}}) =9.75474\times10^{-5}\ \mathrm{mol}. \]
返滴定测得的是未消耗的 EDTA:
\[ \begin{aligned} n_{\mathrm{EDTA,excess}} &=n_{\mathrm{Ni,titrant}}\\ &=(0.09560\ \mathrm{L})(0.0010\ \mathrm{mol\,L^{-1}})\\ &=9.560\times10^{-5}\ \mathrm{mol}. \end{aligned} \]
在减法中保留额外位数以避免舍入误差,可得从所取废水试样中回收的镍的物质的量为
\[ \begin{aligned} n_{\mathrm{Ni,sample}} &=n_{\mathrm{EDTA,added}}-n_{\mathrm{EDTA,excess}}\\ &=9.75474\times10^{-5}-9.560\times10^{-5}\\ &=1.9474\times10^{-6}\ \mathrm{mol}. \end{aligned} \]
这些镍来自 \(10\ \mathrm{mL}=0.010\ \mathrm{L}\) 废水。因此,
\[ \begin{aligned} c_{\mathrm{mass}}(\ce{Ni^2+}) &=\frac{(1.9474\times10^{-6}\ \mathrm{mol}) (58.69\ \mathrm{g\,mol^{-1}}) (10^3\ \mathrm{mg\,g^{-1}})} {0.010\ \mathrm{L}}\\ &=11.429\ \mathrm{mg\,L^{-1}}. \end{aligned} \]
因此,按给定数值计算得到的结果为
\[ \boxed{c_{\mathrm{mass}}(\ce{Ni^2+})\approx11.4\ \mathrm{mg\,L^{-1}}}, \]
或保留两位有效数字时约为 \(11\ \mathrm{mg\,L^{-1}}\)。
100 mL 烧杯不会引入稀释倍数:这里只是将五份各 10 mL 的样品混合,并未要求将其稀释至 100 mL。所得结果代表混合后的废水样品。
9.8. 硫化镍沉淀所需的最低 pH
步骤 5 中回收的镍存在于 \(10\ \mathrm{mL}\) 溶液中,因此沉淀前其浓度为
\[ [\ce{Ni^2+}] =\frac{1.9474\times10^{-6}\ \mathrm{mol}}{0.010\ \mathrm{L}} =1.9474\times10^{-4}\ \mathrm{mol\,L^{-1}}. \]
含硫物种分别为硫化氢 \(\ce{H2S}\),SMILES S;硫氢根离子 \(\ce{HS-}\),SMILES [SH-];以及硫离子 \(\ce{S^2-}\),SMILES [S-2]。
它们的酸解离平衡为
\[ \ce{H2S(aq) <=> H+(aq) + HS-(aq)} \]
以及
\[ \ce{HS-(aq) <=> H+(aq) + S^2-(aq)}. \]
将两个平衡常数表达式相乘,得到
\[ K_{\mathrm{a1}}K_{\mathrm{a2}} = \frac{[\ce{H+}]^2[\ce{S^2-}]}{[\ce{H2S}]}. \]
因此,
\[ [\ce{S^2-}] = \frac{K_{\mathrm{a1}}K_{\mathrm{a2}}[\ce{H2S}]} {[\ce{H+}]^2}. \]
硫化镍(II) \(\ce{NiS}\) 的离子组分 SMILES 为 [Ni+2].[S-2];其沉淀反应为
\[ \ce{Ni^2+(aq) + S^2-(aq) -> NiS(s)}. \]
在刚开始沉淀时,
\[ [\ce{Ni^2+}][\ce{S^2-}]=K_{\mathrm{sp}}. \]
因此,所需的硫离子浓度为
\[ [\ce{S^2-}]_{\mathrm{crit}} = \frac{4.0\times10^{-20}}{1.9474\times10^{-4}} = 2.0540\times10^{-16}\ \mathrm{mol\,L^{-1}}. \]
采用给定的饱和浓度 \([\ce{H2S}]=0.1\ \mathrm{M}\),
\[ \begin{aligned} [\ce{H+}] &= \sqrt{ \frac{K_{\mathrm{a1}}K_{\mathrm{a2}}[\ce{H2S}]} {[\ce{S^2-}]_{\mathrm{crit}}} }\\ &= \sqrt{ \frac{(9.6\times10^{-8})(1.3\times10^{-14})(0.1)} {2.0540\times10^{-16}} }\\ &=7.7948\times10^{-4}\ \mathrm{mol\,L^{-1}}. \end{aligned} \]
所以,
\[ \boxed{\mathrm{pH}_{\min} =-\log_{10}(7.7948\times10^{-4}) =3.108\approx3.11}. \]
升高 pH 会增大硫离子浓度,因此超过这一阈值后有利于沉淀生成。由于步骤 5 选择性地将镍转移至溶液中,因此不需要使用硫化铜的溶度积。
解答已与官方解答核对。本解答与官方解答不同之处,均为官方解答中的错误或印刷错误。
IChO 2020 · Теоретическая задача 9
Количественное определение ионов тяжёлых металлов
| 12% от общего количества баллов | Баллы | 5 | 5 | 8 | 16 | 5 | 6 | 25 | 30 | 100 |
Задача 9. Количественное определение ионов тяжёлых металлов
Для количественного анализа ионов тяжёлых металлов в бассейне сточных вод предприятия аналитик выполнил следующие этапы при 298 K:
Этап 1) Из пяти различных участков бассейна сточных вод отобрали по 10 мл пробы, смешали их в стакане вместимостью 100 мл и затем перемешивали в течение 5 минут с помощью магнитной мешалки.
Этап 2) Из стакана вместимостью 100 мл отобрали 10 мл раствора пробы и при перемешивании добавили 142 мг \(\ce{Na2SO4}\), после чего перенесли раствор в трёхэлектродную ячейку, показанную на рисунке 1a. В этой электрохимической ячейке проволока из \(\ce{Pt}\), электрод \(\ce{Ag/AgCl}\) (3 М \(\ce{KCl}\)) и фольга из \(\ce{Pt}\) служили соответственно рабочим электродом, электродом сравнения и вспомогательным электродом.
Этап 3) Эти электроды подключили к потенциостату и в течение 14 минут поддерживали постоянный потенциал −0.50 В относительно \(\ce{Ag/AgCl}\), как показано на рисунке 1b (горизонтальная линия). Предполагается, что 14 минут достаточно для полного протекания ожидаемых электрохимических реакций.
Рисунок 1. a) Устройство электрохимической ячейки; 1) рабочий электрод (проволока из \(\ce{Pt}\)), 2) электрод сравнения (\(\ce{Ag/AgCl}\), 3 М \(\ce{KCl}\)), 3) вспомогательный электрод (фольга из \(\ce{Pt}\)), 4) кран ячейки, 5) электрохимическая ячейка, 6) 10 мл раствора пробы. b) Изменение потенциала рабочего электрода во времени. Ось y: потенциал/В относительно \(\ce{Ag/AgCl}\), ось x: время/мин.
Этап 4) Электроды промыли дистиллированной водой, поместили в другую электрохимическую ячейку, содержащую 10 мл 0.1 М раствора \(\ce{H2SO4}\), и провели развёртку потенциала от −0.50 до +0.50 В, как показано на рисунке 1b (наклонная нисходящая линия за 2 минуты). Данные о зависимости тока от потенциала на этом этапе представлены на рисунке 2a; этот график напоминает прекрасный вид горы Арарат (Ağrı Dağı), самой высокой горы Турции (рисунок 2b).
Рисунок 2. a) Развёртка потенциала рабочего электрода в зависимости от тока в 0.1 М растворе \(\ce{H2SO4}\) после выдерживания электрода при постоянном потенциале −0.50 В в 10 мл пробы сточной воды, как показано на рисунке 1b (горизонтальная линия). Ось y: ток/мкА, ось x: потенциал/В относительно \(\ce{Ag/AgCl}\), b) Вид вершин Большого и Малого Арарата.
Этап 5) Отобрали ещё 10 мл раствора пробы, приготовленного на этапе 1, и последовательно выполнили операции, описанные на этапах 2 и 3. Электроды промыли дистиллированной водой и поместили в 10 мл 0.1 М раствора \(\ce{H2SO4}\). Затем потенциал рабочего электрода поддерживали постоянным на уровне +0.05 В в течение 14 минут. Предполагается, что 14 минут достаточно для полного протекания ожидаемых электрохимических реакций.
Этап 6) После выполнения этапа 5 раствор из электрохимической ячейки поместили в подходящий сушильный шкаф и выпаривали при 150 °C до получения сухого твёрдого остатка.
Этап 7) К твёрдому остатку, полученному на этапе 6, добавили 5 мл раствора этилендиаминтетрауксусной кислоты (ЭДТА, \(\ce{H4Y}\)) (рисунок 3) и встряхивали до растворения. Известно, что 1 мл раствора ЭДТА эквивалентен 3.85 мг/мл \(\ce{BaCO3}\). Затем pH раствора довели до 10.0. Избыток ЭДТА оттитровали стандартным 0.0010 М раствором \(\ce{Ni(NO3)2}\); было установлено, что до конечной точки титрования израсходовали 95.60 мл раствора \(\ce{Ni(NO3)2}\).
Рисунок 3. Химическая структура ЭДТА (\(\ce{H4Y}\)).
- В воде, насыщенной \(\ce{H2S}\), равновесная концентрация \([\ce{H2S}]\) составляет 0.1 М.
- \(K_{\mathrm{sp}}(\ce{NiS})=4.0\times10^{-20}\); \(K_{\mathrm{sp}}(\ce{CuS})=1.0\times10^{-36}\)
- \(K_{\mathrm{a1}}(\ce{H2S})=9.6\times10^{-8}\); \(K_{\mathrm{a2}}(\ce{H2S})=1.3\times10^{-14}\)
| Реакция | \(E^\circ/\mathrm{V}\) (при 298 K) |
|---|---|
| \(\ce{2H2O(l) + 2e- -> H2(g) + 2OH-(aq)}\) | −0.83 |
| \(\ce{Ni^2+(aq) + 2e- -> Ni(s)}\) | −0.24 |
| \(\ce{2H+(aq) + 2e- -> H2(g)}\) | 0.00 |
| \(\ce{Cu^2+(aq) + 2e- -> Cu(s)}\) | +0.34 |
| \(\ce{Ag+(aq) + e- -> Ag(s)}\) | +0.80 |
| \(\ce{O2(g) + 4H+(aq) + 4e- -> 2H2O(l)}\) | +1.23 |
9.1. Какой из следующих вариантов соответствует пику 1 и пику 2 на рисунке 2a соответственно? Отметьте правильный вариант в листе ответов.
- ☐ Пик 1: электрохимическое восстановление \(\ce{Ni}\) / Пик 2: электрохимическое восстановление \(\ce{Cu}\)
- ☐ Пик 1: электрохимическое восстановление \(\ce{Cu}\) / Пик 2: электрохимическое восстановление \(\ce{Ni}\)
- ☐ Пик 1: электрохимическое восстановление \(\ce{Ni}\) / Пик 2: электрохимическое окисление \(\ce{Cu}\)
- ☐ Пик 1: электрохимическое окисление \(\ce{Ni}\) / Пик 2: электрохимическое окисление \(\ce{Cu}\)
- ☐ Пик 1: электрохимическое окисление \(\ce{Cu}\) / Пик 2: электрохимическое окисление \(\ce{Ni}\)
9.2. Какое из следующих явлений ожидается, если на первом этапе (горизонтальная линия) на рисунке 1b приложить потенциал −1.2 В вместо -0.5 В? Отметьте правильный вариант в листе ответов.
- ☐ Выделение \(\ce{NO}\)
- ☐ Выделение \(\ce{NO2}\)
- ☐ Выделение азота
- ☐ Выделение кислорода
- ☐ Выделение водорода
9.3. Рассчитайте скорость развёртки потенциала для данных, представленных на рисунке 2a, в мВ/с при 298 K.
Измеренная ЭДС следующего элемента составляет 0.437 В.
\[ \ce{Pt},\ce{H2}(0.92\ \mathrm{bar}) \mid \ce{HCl}(1.50\times10^{-2}\ \mathrm{M}),\ce{AgCl}(sat) \mid\ce{Ag} \]
9.4. Рассчитайте стандартный электродный потенциал (В) полуэлемента \(\ce{AgCl(s) + e- -> Ag(s) + Cl-(aq)}\) при 298 K. Примечание: Необходимо привести все вычисления.
9.5. Какой из следующих вариантов описывает основную цель этапа 5 в данном анализе? Отметьте правильный вариант в листе ответов.
- ☐ Модифицирование проволоки из \(\ce{Pt}\) плёнкой сплава \(\ce{Ni}\)–\(\ce{Cu}\)
- ☐ Модифицирование проволоки из \(\ce{Pt}\) плёнкой \(\ce{Ni}\)
- ☐ Электрохимическое растворение как \(\ce{Cu}\), так и \(\ce{Ni}\) с проволоки из \(\ce{Pt}\), модифицированной \(\ce{Cu}\)–\(\ce{Ni}\), с переходом в раствор
- ☐ Электрохимическое растворение \(\ce{Cu}\) с проволоки из \(\ce{Pt}\), модифицированной \(\ce{Cu}\)–\(\ce{Ni}\), с переходом в раствор
- ☐ Электрохимическое растворение \(\ce{Ni}\) с проволоки из \(\ce{Pt}\), модифицированной \(\ce{Cu}\)–\(\ce{Ni}\), с переходом в раствор
9.6. Запишите в листе ответов сокращённые ионные уравнения реакций комплексообразования и обратного титрования на этапе 7
9.7. Рассчитайте концентрацию \(\ce{Ni^2+}\) в сточных водах предприятия в мг/л. Примечание: Необходимо привести все вычисления.
9.8. Рассчитайте минимальное значение pH, при котором начинается осаждение ионов \(\ce{Ni^2+}\) из раствора, полученного на этапе 5, при пропускании через него газа \(\ce{H2S}\) до насыщения. Если вы не смогли решить задание 9.7, используйте для этого задания пробу с концентрацией \(\ce{Ni^2+}\) 20 мг/л. Примечание: Необходимо привести все вычисления.
Условие переведено с официального английского текста.
Ответы
- 9.1. Четвёртый вариант: пик 1 — окисление никеля; пик 2 — окисление меди.
- 9.2. Пятый вариант: выделение водорода, \(\ce{H2}\), SMILES
[H][H]. - 9.3. \(\boxed{v=+8.33\ \mathrm{mV\,s^{-1}}}\).
- 9.4. \(\boxed{E^\circ_{\ce{AgCl/Ag}}=+0.222\ \mathrm{V}}\), относительно стандартного водородного электрода.
- 9.5. Пятый вариант: селективное электрохимическое растворение никеля из медно-никелевого осадка с переходом в раствор.
- 9.6. Комплексообразование: \(\ce{Ni^2+ + H4Y -> [NiY]^2- + 4H+}\). Обратное титрование с использованием обозначения полностью депротонированной ЭДТА: \(\ce{Ni^2+ + Y^4- -> [NiY]^2-}\). Названия частиц и SMILES приведены ниже.
- 9.7. \(\boxed{c_{\mathrm{mass}}(\ce{Ni^2+})\approx11.4\ \mathrm{mg\,L^{-1}}}\), или приблизительно \(11\ \mathrm{mg\,L^{-1}}\) при округлении до двух значащих цифр.
- 9.8. \(\boxed{\mathrm{pH}_{\min}\approx3.11}\).
Решение
9.1. Идентификация пиков электрохимического растворения
На этапе электроосаждения ионы никеля(II), \(\ce{Ni^2+}\), SMILES [Ni+2], и ионы меди(II), \(\ce{Cu^2+}\), SMILES [Cu+2], восстанавливаются на рабочем электроде:
\[ \ce{Ni^2+(aq) + 2e- -> Ni(s)} \] \[ \ce{Cu^2+(aq) + 2e- -> Cu(s)} \]
Последующая развёртка идёт от −0.50 до +0.50 В: потенциал изменяется в сторону более положительных значений, несмотря на нисходящий вид линии на рисунке 1b. Следовательно, осаждённые металлы окисляются и переходят в раствор.
Стандартный потенциал восстановления никеля ниже:
\[ E^\circ_{\ce{Ni^2+/Ni}}=-0.24\ \mathrm{V} < E^\circ_{\ce{Cu^2+/Cu}}=+0.34\ \mathrm{V}. \]
Поэтому никель окисляется первым, что соответствует более раннему пику растворения при менее положительном потенциале, а затем окисляется медь:
\[ \text{Пик 1:}\qquad \ce{Ni(s) -> Ni^2+(aq) + 2e-} \] \[ \text{Пик 2:}\qquad \ce{Cu(s) -> Cu^2+(aq) + 2e-}. \]
Таким образом, следует отметить четвёртый вариант.
9.2. Влияние приложения потенциала −1.2 В
Значительно более отрицательный потенциал рабочего электрода способствует восстановлению воды и выделению водорода:
\[ \ce{2H2O(l) + 2e- -> H2(g) + 2OH-(aq)}. \]
Участвующие частицы — вода, SMILES O; водород, SMILES [H][H]; и гидроксид-ион, SMILES [OH-].
Таким образом, следует отметить пятый вариант: выделение водорода.
9.3. Скорость развёртки потенциала
Потенциал изменяется на \(1.00\ \mathrm{V}\) за \(2\ \mathrm{min}=120\ \mathrm{s}\):
\[ v=\frac{\Delta E}{\Delta t} =\frac{(+0.50)-(-0.50)}{120} =8.333\times10^{-3}\ \mathrm{V\,s^{-1}}. \]
Следовательно,
\[ \boxed{v=+8.33\ \mathrm{mV\,s^{-1}}}. \]
Положительный знак указывает на увеличение потенциала.
9.4. Стандартный потенциал хлорсеребряного электрода
Соляная кислота является источником ионов водорода, \(\ce{H+}\), SMILES [H+], и хлорид-ионов, \(\ce{Cl-}\), SMILES [Cl-]. Хлорид серебра(I) имеет запись SMILES ионных компонентов [Ag+].[Cl-]; она задаёт его составные части, а не кристаллическую решётку.
На левом электроде происходит окисление:
\[ \ce{H2(g) -> 2H+(aq) + 2e-}. \]
На правом электроде происходит восстановление:
\[ \ce{2AgCl(s) + 2e- -> 2Ag(s) + 2Cl-(aq)}. \]
Следовательно, суммарная реакция в элементе имеет вид
\[ \ce{H2(g) + 2AgCl(s) -> 2H+(aq) + 2Ag(s) + 2Cl-(aq)}. \]
Переносятся два электрона, а реакционное отношение равно
\[ Q=\frac{a_{\ce{H+}}^2a_{\ce{Cl-}}^2} {p_{\ce{H2}}/p^\circ}. \]
Принимая активности в растворе равными концентрациям, делённым на стандартную концентрацию, и пренебрегая малым вкладом растворённого хлорида серебра в концентрацию хлорид-ионов, получаем
\[ a_{\ce{H+}}=a_{\ce{Cl-}}=1.50\times10^{-2}, \qquad \frac{p_{\ce{H2}}}{p^\circ}=0.92. \]
Таким образом,
\[ Q=\frac{(1.50\times10^{-2})^4}{0.92} =5.5027\times10^{-8}. \]
Поскольку для стандартного водородного электрода \(E^\circ=0\),
\[ E^\circ_{\mathrm{cell}}=E^\circ_{\ce{AgCl/Ag}}. \]
Уравнение Нернста даёт
\[ E_{\mathrm{cell}} =E^\circ_{\mathrm{cell}}-\frac{RT}{2F}\ln Q, \]
поэтому, используя \(R=8.314\ \mathrm{J\,mol^{-1}\,K^{-1}}\) и \(F=96485\ \mathrm{C\,mol^{-1}}\), получаем
\[ \begin{aligned} E^\circ_{\ce{AgCl/Ag}} &=0.437+ \frac{(8.314)(298)}{2(96485)} \ln(5.5027\times10^{-8})\\ &=0.437-0.2146\\ &=0.2224\ \mathrm{V}. \end{aligned} \]
Следовательно,
\[ \boxed{E^\circ_{\ce{AgCl/Ag}}=+0.222\ \mathrm{V}\text{ относительно SHE}}. \]
9.5. Назначение этапа 5
На рисунке 2a потенциал +0.05 В расположен после пика растворения никеля и перед пиком растворения меди. Выдерживание электрода при этом потенциале приводит к селективному окислению осаждённого никеля:
\[ \ce{Ni(s) -> Ni^2+(aq) + 2e-}. \]
В соответствии с указанным в условии предположением о полноте протекания реакции никель переходит в свежий раствор кислоты, а медь остаётся на электроде. Это позволяет отделить никель для его последующего определения.
Таким образом, следует отметить пятый вариант.
9.6. Уравнения комплексообразования и обратного титрования
Лиганд и комплекс:
- Этилендиаминтетрауксусная кислота, \(\ce{H4Y}\):
O=C(O)CN(CC(=O)O)CCN(CC(=O)O)CC(=O)O - Этилендиаминтетраацетат-ион, \(\ce{Y^4-}\):
O=C([O-])CN(CC(=O)[O-])CCN(CC(=O)[O-])CC(=O)[O-] - Комплекс никеля(II) с ЭДТА, \(\ce{[NiY]^2-}\), с использованием SMILES с донорно-акцепторными связями:
[Ni+2]12345<-N(CC(=O)[O-]->1)(CC(=O)[O-]->2)CCN->3(CC(=O)[O-]->4)CC(=O)[O-]->5
ЭДТА координируется через два атома азота аминогрупп и по одному атому кислорода каждой из четырёх карбоксилатных групп. Это создаёт приблизительно октаэдрическое координационное окружение никеля. Запись SMILES задаёт связи с донорными атомами; конкретный координационный стереоизомер или конформация не задаются.
Для комплексообразования никеля из пробы, записанного с использованием кислоты, указанной в условии,
\[ \boxed{\ce{Ni^2+(aq) + H4Y(aq) -> [NiY]^2-(aq) + 4H+(aq)}}. \]
Для обратного титрования избытка ЭДТА, записанного с использованием полностью депротонированного лиганда,
\[ \boxed{\ce{Ni^2+(aq) + Y^4-(aq) -> [NiY]^2-(aq)}}. \]
Это альтернативные способы записи одного и того же процесса комплексообразования, различающиеся выбранной степенью протонирования. Второе уравнение не требует, чтобы вся несвязанная в комплекс ЭДТА при pH 10 существовала в форме \(\ce{Y^4-}\); комплексообразование сопровождается равновесиями протонирования.
Принципиально важно, что на обеих стадиях один моль никеля(II) расходует один моль ЭДТА.
9.7. Концентрация никеля в сточной воде
Данные о стандартизации ЭДТА следует понимать так: каждый миллилитр раствора ЭДТА эквивалентен \(3.85\ \mathrm{mg}\) карбоната бария.
Карбонат бария, \(\ce{BaCO3}\), имеет запись SMILES ионных компонентов [Ba+2].[O-]C(=O)[O-]. Каждый моль содержит один моль ионов бария(II), [Ba+2], что соответствует одному молю ЭДТА в комплексе металл–ЭДТА состава 1:1.
Используя
\[ M(\ce{BaCO3})=197.34\ \mathrm{g\,mol^{-1}}, \qquad M(\ce{Ni})=58.69\ \mathrm{g\,mol^{-1}}, \]
получаем концентрацию ЭДТА:
\[ c_{\mathrm{EDTA}} = \frac{3.85\times10^{-3}\ \mathrm{g}/ (197.34\ \mathrm{g\,mol^{-1}})} {1.00\times10^{-3}\ \mathrm{L}} = 0.0195095\ \mathrm{mol\,L^{-1}}. \]
Количество вещества, добавленное с \(5\ \mathrm{mL}\) раствора, равно
\[ n_{\mathrm{EDTA,added}} =(0.005\ \mathrm{L})(0.0195095\ \mathrm{mol\,L^{-1}}) =9.75474\times10^{-5}\ \mathrm{mol}. \]
Обратное титрование позволяет определить количество неизрасходованной ЭДТА:
\[ \begin{aligned} n_{\mathrm{EDTA,excess}} &=n_{\mathrm{Ni,titrant}}\\ &=(0.09560\ \mathrm{L})(0.0010\ \mathrm{mol\,L^{-1}})\\ &=9.560\times10^{-5}\ \mathrm{mol}. \end{aligned} \]
Сохраняя дополнительные цифры при вычитании, получаем количество никеля, извлечённого из аликвоты сточной воды:
\[ \begin{aligned} n_{\mathrm{Ni,sample}} &=n_{\mathrm{EDTA,added}}-n_{\mathrm{EDTA,excess}}\\ &=9.75474\times10^{-5}-9.560\times10^{-5}\\ &=1.9474\times10^{-6}\ \mathrm{mol}. \end{aligned} \]
Этот никель содержался в \(10\ \mathrm{mL}=0.010\ \mathrm{L}\) сточной воды. Следовательно,
\[ \begin{aligned} c_{\mathrm{mass}}(\ce{Ni^2+}) &=\frac{(1.9474\times10^{-6}\ \mathrm{mol}) (58.69\ \mathrm{g\,mol^{-1}}) (10^3\ \mathrm{mg\,g^{-1}})} {0.010\ \mathrm{L}}\\ &=11.429\ \mathrm{mg\,L^{-1}}. \end{aligned} \]
Таким образом, номинальный результат расчёта составляет
\[ \boxed{c_{\mathrm{mass}}(\ce{Ni^2+})\approx11.4\ \mathrm{mg\,L^{-1}}}, \]
или приблизительно \(11\ \mathrm{mg\,L^{-1}}\) при округлении до двух значащих цифр.
Использование стакана вместимостью 100 мл не вводит коэффициент разбавления: были смешаны пять порций по 10 мл, а указания разбавлять их до 100 мл не было. Результат относится к объединённой пробе сточной воды.
9.8. Минимальный pH осаждения сульфида никеля
Никель, извлечённый на этапе 5, содержится в \(10\ \mathrm{mL}\), поэтому его концентрация перед осаждением равна
\[ [\ce{Ni^2+}] =\frac{1.9474\times10^{-6}\ \mathrm{mol}}{0.010\ \mathrm{L}} =1.9474\times10^{-4}\ \mathrm{mol\,L^{-1}}. \]
Серосодержащие частицы — сероводород, \(\ce{H2S}\), SMILES S; гидросульфид-ион, \(\ce{HS-}\), SMILES [SH-]; и сульфид-ион, \(\ce{S^2-}\), SMILES [S-2].
Их равновесия кислотной диссоциации имеют вид
\[ \ce{H2S(aq) <=> H+(aq) + HS-(aq)} \]
и
\[ \ce{HS-(aq) <=> H+(aq) + S^2-(aq)}. \]
Перемножение выражений для двух констант равновесия даёт
\[ K_{\mathrm{a1}}K_{\mathrm{a2}} = \frac{[\ce{H+}]^2[\ce{S^2-}]}{[\ce{H2S}]}. \]
Следовательно,
\[ [\ce{S^2-}] = \frac{K_{\mathrm{a1}}K_{\mathrm{a2}}[\ce{H2S}]} {[\ce{H+}]^2}. \]
Сульфид никеля(II), \(\ce{NiS}\), имеет запись SMILES ионных компонентов [Ni+2].[S-2]; реакция его осаждения имеет вид
\[ \ce{Ni^2+(aq) + S^2-(aq) -> NiS(s)}. \]
В момент начала осаждения
\[ [\ce{Ni^2+}][\ce{S^2-}]=K_{\mathrm{sp}}. \]
Таким образом, необходимая концентрация сульфид-ионов равна
\[ [\ce{S^2-}]_{\mathrm{crit}} = \frac{4.0\times10^{-20}}{1.9474\times10^{-4}} = 2.0540\times10^{-16}\ \mathrm{mol\,L^{-1}}. \]
Используя заданную концентрацию в насыщенном растворе \([\ce{H2S}]=0.1\ \mathrm{M}\), получаем
\[ \begin{aligned} [\ce{H+}] &= \sqrt{ \frac{K_{\mathrm{a1}}K_{\mathrm{a2}}[\ce{H2S}]} {[\ce{S^2-}]_{\mathrm{crit}}} }\\ &= \sqrt{ \frac{(9.6\times10^{-8})(1.3\times10^{-14})(0.1)} {2.0540\times10^{-16}} }\\ &=7.7948\times10^{-4}\ \mathrm{mol\,L^{-1}}. \end{aligned} \]
Следовательно,
\[ \boxed{\mathrm{pH}_{\min} =-\log_{10}(7.7948\times10^{-4}) =3.108\approx3.11}. \]
При увеличении pH концентрация сульфид-ионов возрастает, поэтому выше этого порогового значения осаждение становится термодинамически выгодным. Произведение растворимости сульфида меди не требуется, поскольку на этапе 5 в раствор селективно переводится никель.
Решение проверено по официальному решению. Там, где это решение расходится с официальным, в официальном решении есть ошибка или опечатка.
IChO 2020 · مسألة نظرية 9
التقدير الكمي لأيونات الفلزات الثقيلة
| 12% من المجموع الكلي | النقاط | 5 | 5 | 8 | 16 | 5 | 6 | 25 | 30 | 100 |
المسألة 9. التقدير الكمي لأيونات الفلزات الثقيلة
لإجراء التحليل الكمي لأيونات الفلزات الثقيلة في حوض مياه الصرف لأحد المصانع، نفّذ محلّل الخطوات الآتية عند 298 K:
الخطوة 1) أُخذت عينات حجم كل منها 10 mL من خمس مناطق مختلفة في حوض مياه الصرف، ومُزجت في كأس سعتها 100 mL، ثم حُرّكت لمدة 5 دقائق باستخدام محرّك مغناطيسي.
الخطوة 2) أُخذ 10 mL من محلول العينة من الكأس ذات السعة 100 mL، وأُضيف إليه 142 mg من \(\ce{Na2SO4}\) مع التحريك، ثم نُقل إلى خلية ذات ثلاثة أقطاب كما يظهر في الشكل 1a. في هذه الخلية الكهروكيميائية، استُخدم سلك من \(\ce{Pt}\)، وقطب \(\ce{Ag/AgCl}\) (3 M \(\ce{KCl}\))، ورقيقة من \(\ce{Pt}\) بوصفها قطب العمل والقطب المرجعي والقطب المقابل، على الترتيب.
الخطوة 3) وُصلت هذه الأقطاب بجهاز تثبيت الجهد، وطُبّق جهد ثابت مقداره −0.50 V بالنسبة إلى \(\ce{Ag/AgCl}\) لمدة 14 دقيقة، كما يظهر في الشكل 1b (الخط الأفقي). يُفترض أن 14 دقيقة كافية لإتمام التفاعلات الكهروكيميائية المتوقعة.
الشكل 1. a) تصميم الخلية الكهروكيميائية؛ 1) قطب العمل (سلك \(\ce{Pt}\))، 2) القطب المرجعي (\(\ce{Ag/AgCl}\)، 3M \(\ce{KCl}\))، 3) القطب المقابل (رقيقة \(\ce{Pt}\))، 4) صنبور الخلية، 5) الخلية الكهروكيميائية، 6) 10 mL من محلول العينة. b) تغيّر جهد قطب العمل بدلالة الزمن. المحور y: الجهد/V بالنسبة إلى \(\ce{Ag/AgCl}\)، المحور x: الزمن/min.
الخطوة 4) شُطفت الأقطاب بالماء المقطر، ووُضعت في خلية كهروكيميائية أخرى تحتوي على 10 mL من محلول \(\ce{H2SO4}\) بتركيز 0.1 M، وأُجري مسح للجهد بين −0.50 و+0.50 V كما يظهر في الشكل 1b (الخط المنحدر إلى أسفل خلال دقيقتين). تُعرض بيانات التيار مقابل الجهد لهذه الخطوة في الشكل 2a، الذي يشبه منظرًا رائعًا لـجبل أرارات (Ağrı Dağı)، أعلى جبل في تركيا (الشكل 2b).
الشكل 2. a) مسح جهد قطب العمل بدلالة التيار في محلول \(\ce{H2SO4}\) بتركيز 0.1 M بعد تثبيته عند جهد −0.50 V في 10 mL من عينة مياه الصرف كما يظهر في الشكل 1b (الخط الأفقي). المحور y: التيار/μA، المحور x: الجهد/V بالنسبة إلى \(\ce{Ag/AgCl}\)، b) منظر لقمتي أرارات الكبرى والصغرى.
الخطوة 5) أُخذ 10 mL أخرى من محلول العينة المحضّر في الخطوة 1، وطُبّقت العمليات الموضّحة في الخطوتين 2 و3 بهذا الترتيب. شُطفت الأقطاب بالماء المقطر ووُضعت في 10 mL من محلول \(\ce{H2SO4}\) بتركيز 0.1 M. ثم ثُبّت جهد قطب العمل عند +0.05 V لمدة 14 دقيقة. يُفترض أن 14 دقيقة كافية لإتمام التفاعلات الكهروكيميائية المتوقعة.
الخطوة 6) بعد تنفيذ الخطوة 5، وُضع المحلول الموجود في الخلية الكهروكيميائية في فرن مناسب لتبخيره عند 150 °C حتى الحصول على مادة صلبة جافة.
الخطوة 7) أُضيف 5 mL من محلول حمض الإيثيلين ثنائي الأمين رباعي الأسيتيك (EDTA، \(\ce{H4Y}\)) (الشكل 3) إلى المادة الصلبة الناتجة في الخطوة 6، ورُجّ المزيج لإذابتها. من المعلوم أن 1 mL من محلول EDTA يكافئ 3.85 mg/mL من \(\ce{BaCO3}\). ثم ضُبط الأس الهيدروجيني للمحلول عند 10.0. عُويِر فائض EDTA بمحلول قياسي من \(\ce{Ni(NO3)2}\) بتركيز 0.0010 M، ولوحظ استهلاك 95.60 mL من محلول \(\ce{Ni(NO3)2}\) حتى نقطة النهاية.
الشكل 3. البنية الكيميائية لـ EDTA (\(\ce{H4Y}\)).
- في الماء المشبع بـ \(\ce{H2S}\)، يكون تركيز الاتزان \([\ce{H2S}]\) مساويًا لـ 0.1 M.
- \(K_{\mathrm{sp}}(\ce{NiS})=4.0\times10^{-20}\); \(K_{\mathrm{sp}}(\ce{CuS})=1.0\times10^{-36}\)
- \(K_{\mathrm{a1}}(\ce{H2S})=9.6\times10^{-8}\); \(K_{\mathrm{a2}}(\ce{H2S})=1.3\times10^{-14}\)
| التفاعل | \(E^\circ/\mathrm{V}\) (عند 298 K) |
|---|---|
| \(\ce{2H2O(l) + 2e- -> H2(g) + 2OH-(aq)}\) | −0.83 |
| \(\ce{Ni^2+(aq) + 2e- -> Ni(s)}\) | −0.24 |
| \(\ce{2H+(aq) + 2e- -> H2(g)}\) | 0.00 |
| \(\ce{Cu^2+(aq) + 2e- -> Cu(s)}\) | +0.34 |
| \(\ce{Ag+(aq) + e- -> Ag(s)}\) | +0.80 |
| \(\ce{O2(g) + 4H+(aq) + 4e- -> 2H2O(l)}\) | +1.23 |
9.1. أيّ مما يأتي يمكن أن يمثّل القمة 1 والقمة 2 في الشكل 2a، على الترتيب؟ ضع علامة في المربع الصحيح في ورقة الإجابة.
- ☐ القمة 1: الاختزال الكهروكيميائي لـ \(\ce{Ni}\) / القمة 2: الاختزال الكهروكيميائي لـ \(\ce{Cu}\)
- ☐ القمة 1: الاختزال الكهروكيميائي لـ \(\ce{Cu}\) / القمة 2: الاختزال الكهروكيميائي لـ \(\ce{Ni}\)
- ☐ القمة 1: الاختزال الكهروكيميائي لـ \(\ce{Ni}\) / القمة 2: الأكسدة الكهروكيميائية لـ \(\ce{Cu}\)
- ☐ القمة 1: الأكسدة الكهروكيميائية لـ \(\ce{Ni}\) / القمة 2: الأكسدة الكهروكيميائية لـ \(\ce{Cu}\)
- ☐ القمة 1: الأكسدة الكهروكيميائية لـ \(\ce{Cu}\) / القمة 2: الأكسدة الكهروكيميائية لـ \(\ce{Ni}\)
9.2. أيّ مما يأتي يُتوقع حدوثه إذا طُبّق جهد −1.2 V بدلًا من -0.5 V في الخطوة الأولى (الخط الأفقي) في الشكل 1b؟ ضع علامة في المربع الصحيح في ورقة الإجابة.
- ☐ تصاعد \(\ce{NO}\)
- ☐ تصاعد \(\ce{NO2}\)
- ☐ تصاعد النيتروجين
- ☐ تصاعد الأكسجين
- ☐ تصاعد الهيدروجين
9.3. احسب معدل المسح للبيانات المعروضة في الشكل 2a بوحدة mV/s عند 298 K.
قِيس جهد الخلية الآتية فكان 0.437 V.
\[ \ce{Pt},\ce{H2}(0.92\ \mathrm{bar}) \mid \ce{HCl}(1.50\times10^{-2}\ \mathrm{M}),\ce{AgCl}(sat) \mid\ce{Ag} \]
9.4. احسب قيمة جهد القطب القياسي (V) لنصف الخلية \(\ce{AgCl(s) + e- -> Ag(s) + Cl-(aq)}\) عند 298 K. ملاحظة: يجب إظهار جميع خطوات الحساب.
9.5. أيّ مما يأتي يمثّل الغرض الرئيسي من الخطوة 5 في هذا التحليل؟ ضع علامة في المربع الصحيح في ورقة الإجابة.
- ☐ تعديل سلك \(\ce{Pt}\) بغشاء من سبيكة \(\ce{Ni}\)–\(\ce{Cu}\)
- ☐ تعديل سلك \(\ce{Pt}\) بغشاء من \(\ce{Ni}\)
- ☐ التجريد الكهروكيميائي لكلٍّ من \(\ce{Cu}\) و\(\ce{Ni}\) من سلك \(\ce{Pt}\) المعدّل بـ \(\ce{Cu}\)–\(\ce{Ni}\) إلى المحلول
- ☐ التجريد الكهروكيميائي لـ \(\ce{Cu}\) من سلك \(\ce{Pt}\) المعدّل بـ \(\ce{Cu}\)–\(\ce{Ni}\) إلى المحلول
- ☐ التجريد الكهروكيميائي لـ \(\ce{Ni}\) من سلك \(\ce{Pt}\) المعدّل بـ \(\ce{Cu}\)–\(\ce{Ni}\) إلى المحلول
9.6. اكتب المعادلات الأيونية الصافية لتفاعل تكوين المعقّد وتفاعل المعايرة الراجعة في الخطوة 7 في ورقة الإجابة
9.7. احسب تركيز \(\ce{Ni^2+}\) بوحدة mg/L في مياه صرف المصنع. ملاحظة: يجب إظهار جميع خطوات الحساب.
9.8. احسب أدنى قيمة للأس الهيدروجيني يبدأ عندها ترسيب أيونات \(\ce{Ni^2+}\) في المحلول الناتج في الخطوة 5، عند تمرير غاز \(\ce{H2S}\) في المحلول حتى الإشباع. إذا لم تتمكن من حل السؤال 9.7، فاستخدم عينة بتركيز 20 mg/L من \(\ce{Ni^2+}\) لهذا السؤال. ملاحظة: يجب إظهار جميع خطوات الحساب.
نص المسألة مترجم عن النص الإنجليزي الرسمي.
الإجابات
- 9.1. المربع الرابع: القمة 1 هي أكسدة النيكل؛ والقمة 2 هي أكسدة النحاس.
- 9.2. المربع الخامس: تصاعد الهيدروجين، \(\ce{H2}\)، وصيغة SMILES هي
[H][H]. - 9.3. \(\boxed{v=+8.33\ \mathrm{mV\,s^{-1}}}\).
- 9.4. \(\boxed{E^\circ_{\ce{AgCl/Ag}}=+0.222\ \mathrm{V}}\)، بالنسبة إلى قطب الهيدروجين القياسي.
- 9.5. المربع الخامس: التجريد الكهروكيميائي الانتقائي للنيكل من راسب النحاس–النيكل إلى المحلول.
- 9.6. تكوين المعقّد: \(\ce{Ni^2+ + H4Y -> [NiY]^2- + 4H+}\). المعايرة الراجعة، باستخدام ترميز EDTA المنزوع البروتونات بالكامل: \(\ce{Ni^2+ + Y^4- -> [NiY]^2-}\). ترد أسماء الأنواع الكيميائية وصيغ SMILES أدناه.
- 9.7. \(\boxed{c_{\mathrm{mass}}(\ce{Ni^2+})\approx11.4\ \mathrm{mg\,L^{-1}}}\)، أو نحو \(11\ \mathrm{mg\,L^{-1}}\) برقمين معنويين.
- 9.8. \(\boxed{\mathrm{pH}_{\min}\approx3.11}\).
الحل
9.1. تعيين قمتي التجريد
أثناء خطوة الترسيب، تُختزل أيونات النيكل(II)، \(\ce{Ni^2+}\)، ذات صيغة SMILES [Ni+2]، وأيونات النحاس(II)، \(\ce{Cu^2+}\)، ذات صيغة SMILES [Cu+2]، وتترسّب على قطب العمل:
\[ \ce{Ni^2+(aq) + 2e- -> Ni(s)} \] \[ \ce{Cu^2+(aq) + 2e- -> Cu(s)} \]
يمتد المسح اللاحق من −0.50 إلى +0.50 V: أي إنه يتجه نحو جهد أكثر إيجابية، على الرغم من ظهور الخط منحدرًا إلى أسفل في الشكل 1b. لذلك تتأكسد الفلزات المترسّبة وتُجرَّد إلى المحلول.
للنيكل جهد اختزال قياسي أقل:
\[ E^\circ_{\ce{Ni^2+/Ni}}=-0.24\ \mathrm{V} < E^\circ_{\ce{Cu^2+/Cu}}=+0.34\ \mathrm{V}. \]
وعليه، يتأكسد النيكل عند قمة التجريد الأسبق والأقل إيجابية، ثم يليه النحاس:
\[ \text{القمة 1:}\qquad \ce{Ni(s) -> Ni^2+(aq) + 2e-} \] \[ \text{القمة 2:}\qquad \ce{Cu(s) -> Cu^2+(aq) + 2e-}. \]
إذن، ضع علامة في المربع الرابع.
9.2. أثر تطبيق −1.2 V
يعزّز جهد قطب العمل الأكثر سلبية بكثير اختزال الماء وتصاعد الهيدروجين:
\[ \ce{2H2O(l) + 2e- -> H2(g) + 2OH-(aq)}. \]
الأنواع الكيميائية هي الماء، وصيغة SMILES له O؛ والهيدروجين، وصيغة SMILES له [H][H]؛ وأيون الهيدروكسيد، وصيغة SMILES له [OH-].
إذن، ضع علامة في المربع الخامس: تصاعد الهيدروجين.
9.3. معدل المسح
يتغيّر الجهد بمقدار \(1.00\ \mathrm{V}\) خلال \(2\ \mathrm{min}=120\ \mathrm{s}\):
\[ v=\frac{\Delta E}{\Delta t} =\frac{(+0.50)-(-0.50)}{120} =8.333\times10^{-3}\ \mathrm{V\,s^{-1}}. \]
ومن ثم،
\[ \boxed{v=+8.33\ \mathrm{mV\,s^{-1}}}. \]
تشير الإشارة الموجبة إلى ازدياد الجهد.
9.4. الجهد القياسي لقطب الفضة/كلوريد الفضة
يوفّر حمض الهيدروكلوريك أيونات الهيدروجين، \(\ce{H+}\)، ذات صيغة SMILES [H+]، وأيونات الكلوريد، \(\ce{Cl-}\)، ذات صيغة SMILES [Cl-]. صيغة SMILES للمكوّنات الأيونية لكلوريد الفضة(I) هي [Ag+].[Cl-]؛ وهي تحدّد مكوّناته، لا شبكته البلورية.
تحدث الأكسدة عند القطب الأيسر:
\[ \ce{H2(g) -> 2H+(aq) + 2e-}. \]
ويحدث الاختزال عند القطب الأيمن:
\[ \ce{2AgCl(s) + 2e- -> 2Ag(s) + 2Cl-(aq)}. \]
ومن ثم يكون التفاعل الكلي للخلية
\[ \ce{H2(g) + 2AgCl(s) -> 2H+(aq) + 2Ag(s) + 2Cl-(aq)}. \]
ينتقل إلكترونان، ويكون حاصل التفاعل
\[ Q=\frac{a_{\ce{H+}}^2a_{\ce{Cl-}}^2} {p_{\ce{H2}}/p^\circ}. \]
باعتبار فعاليات الأنواع في المحلول مساوية لتراكيزها مقسومة على التركيز القياسي، وبإهمال المساهمة الصغيرة لكلوريد الفضة الذائب في تركيز الكلوريد،
\[ a_{\ce{H+}}=a_{\ce{Cl-}}=1.50\times10^{-2}, \qquad \frac{p_{\ce{H2}}}{p^\circ}=0.92. \]
إذن،
\[ Q=\frac{(1.50\times10^{-2})^4}{0.92} =5.5027\times10^{-8}. \]
بما أن قطب الهيدروجين القياسي له \(E^\circ=0\)،
\[ E^\circ_{\mathrm{cell}}=E^\circ_{\ce{AgCl/Ag}}. \]
تعطي معادلة نرنست
\[ E_{\mathrm{cell}} =E^\circ_{\mathrm{cell}}-\frac{RT}{2F}\ln Q, \]
ومن ثم، باستخدام \(R=8.314\ \mathrm{J\,mol^{-1}\,K^{-1}}\) و \(F=96485\ \mathrm{C\,mol^{-1}}\)،
\[ \begin{aligned} E^\circ_{\ce{AgCl/Ag}} &=0.437+ \frac{(8.314)(298)}{2(96485)} \ln(5.5027\times10^{-8})\\ &=0.437-0.2146\\ &=0.2224\ \mathrm{V}. \end{aligned} \]
ومن ثم،
\[ \boxed{E^\circ_{\ce{AgCl/Ag}}=+0.222\ \mathrm{V}\text{ بالنسبة إلى SHE}}. \]
9.5. الغرض من الخطوة 5
في الشكل 2a، يقع الجهد +0.05 V بعد قمة تجريد النيكل وقبل قمة تجريد النحاس. يؤدي تثبيت القطب عند هذا الجهد إلى أكسدة النيكل المترسّب بصورة انتقائية:
\[ \ce{Ni(s) -> Ni^2+(aq) + 2e-}. \]
وفقًا لافتراض اكتمال التفاعل الوارد في المسألة، ينتقل النيكل إلى المحلول الحمضي الجديد، بينما يبقى النحاس على القطب. وبذلك يُفصل النيكل لتقديره لاحقًا.
إذن، ضع علامة في المربع الخامس.
9.6. معادلات تكوين المعقّد والمعايرة الراجعة
الربيطة والمعقّد هما:
- حمض الإيثيلين ثنائي الأمين رباعي الأسيتيك، \(\ce{H4Y}\):
O=C(O)CN(CC(=O)O)CCN(CC(=O)O)CC(=O)O - أيون الإيثيلين ثنائي الأمين رباعي الأسيتات، \(\ce{Y^4-}\):
O=C([O-])CN(CC(=O)[O-])CCN(CC(=O)[O-])CC(=O)[O-] - معقّد النيكل(II)–EDTA، \(\ce{[NiY]^2-}\)، باستخدام صيغة SMILES للروابط التناسقية:
[Ni+2]12345<-N(CC(=O)[O-]->1)(CC(=O)[O-]->2)CCN->3(CC(=O)[O-]->4)CC(=O)[O-]->5
يتناسق EDTA من خلال ذرتي النيتروجين الأمينيتين وذرة أكسجين واحدة من كل مجموعة من مجموعات الكربوكسيلات الأربع فيه. وينتج عن ذلك محيط تناسقي حول النيكل يقارب الشكل ثماني السطوح. تحدّد صيغة SMILES كيفية اتصال الذرات المانحة؛ ولا تحدّد متماكبًا فراغيًا تناسقيًا أو هيئة فراغية بعينها.
لتكوين معقّد النيكل الموجود في العينة، مع كتابة المعادلة باستخدام الحمض المحدّد في المسألة،
\[ \boxed{\ce{Ni^2+(aq) + H4Y(aq) -> [NiY]^2-(aq) + 4H+(aq)}}. \]
وللمعايرة الراجعة لفائض EDTA، مع كتابة المعادلة باستخدام الربيطة المنزوعة البروتونات بالكامل،
\[ \boxed{\ce{Ni^2+(aq) + Y^4-(aq) -> [NiY]^2-(aq)}}. \]
هاتان طريقتان بديلتان لتمثيل حالة البروتنة في عملية تكوين المعقّد نفسها. لا تشترط المعادلة الثانية وجود كل EDTA غير المرتبط بمعقّد على صورة \(\ce{Y^4-}\) عند أس هيدروجيني 10؛ إذ ترافق اتزانات البروتنة عملية تكوين المعقّد.
والأمر الحاسم هو أن مولًا واحدًا من النيكل(II) يستهلك مولًا واحدًا من EDTA في كلتا المرحلتين.
9.7. تركيز النيكل في مياه الصرف
تُفسَّر معايرة محلول EDTA لتحديد تركيزه على أن كل مليلتر من محلوله يكافئ \(3.85\ \mathrm{mg}\) من كربونات الباريوم.
صيغة SMILES للمكوّنات الأيونية لكربونات الباريوم، \(\ce{BaCO3}\)، هي [Ba+2].[O-]C(=O)[O-]. يحتوي كل مول منها على مول واحد من أيون الباريوم(II)، [Ba+2]، يقابله مول واحد من EDTA في معقّد فلز–EDTA بنسبة 1:1.
باستخدام
\[ M(\ce{BaCO3})=197.34\ \mathrm{g\,mol^{-1}}, \qquad M(\ce{Ni})=58.69\ \mathrm{g\,mol^{-1}}, \]
يكون تركيز EDTA
\[ c_{\mathrm{EDTA}} = \frac{3.85\times10^{-3}\ \mathrm{g}/ (197.34\ \mathrm{g\,mol^{-1}})} {1.00\times10^{-3}\ \mathrm{L}} = 0.0195095\ \mathrm{mol\,L^{-1}}. \]
وكمية المادة المضافة في \(5\ \mathrm{mL}\) هي
\[ n_{\mathrm{EDTA,added}} =(0.005\ \mathrm{L})(0.0195095\ \mathrm{mol\,L^{-1}}) =9.75474\times10^{-5}\ \mathrm{mol}. \]
تقيس المعايرة الراجعة كمية EDTA غير المستهلكة:
\[ \begin{aligned} n_{\mathrm{EDTA,excess}} &=n_{\mathrm{Ni,titrant}}\\ &=(0.09560\ \mathrm{L})(0.0010\ \mathrm{mol\,L^{-1}})\\ &=9.560\times10^{-5}\ \mathrm{mol}. \end{aligned} \]
مع الاحتفاظ بأرقام إضافية في عملية الطرح لتجنّب خطأ التقريب، تكون كمية النيكل المستخلصة من الجزء المأخوذ من عينة مياه الصرف
\[ \begin{aligned} n_{\mathrm{Ni,sample}} &=n_{\mathrm{EDTA,added}}-n_{\mathrm{EDTA,excess}}\\ &=9.75474\times10^{-5}-9.560\times10^{-5}\\ &=1.9474\times10^{-6}\ \mathrm{mol}. \end{aligned} \]
جاء هذا النيكل من \(10\ \mathrm{mL}=0.010\ \mathrm{L}\) من مياه الصرف. وعليه،
\[ \begin{aligned} c_{\mathrm{mass}}(\ce{Ni^2+}) &=\frac{(1.9474\times10^{-6}\ \mathrm{mol}) (58.69\ \mathrm{g\,mol^{-1}}) (10^3\ \mathrm{mg\,g^{-1}})} {0.010\ \mathrm{L}}\\ &=11.429\ \mathrm{mg\,L^{-1}}. \end{aligned} \]
إذن، النتيجة الاسمية المحسوبة هي
\[ \boxed{c_{\mathrm{mass}}(\ce{Ni^2+})\approx11.4\ \mathrm{mg\,L^{-1}}}, \]
أو نحو \(11\ \mathrm{mg\,L^{-1}}\) برقمين معنويين.
الكأس ذات السعة 100 mL لا تُدخل عامل تخفيف: فقد مُزجت خمسة أجزاء حجم كل منها 10 mL، من دون أي تعليمات بتخفيفها إلى 100 mL. وتمثّل النتيجة عينة مياه الصرف المجمّعة.
9.8. أدنى أس هيدروجيني لترسيب كبريتيد النيكل
يوجد النيكل المستخلص في الخطوة 5 في حجم \(10\ \mathrm{mL}\)، لذا يكون تركيزه قبل الترسيب
\[ [\ce{Ni^2+}] =\frac{1.9474\times10^{-6}\ \mathrm{mol}}{0.010\ \mathrm{L}} =1.9474\times10^{-4}\ \mathrm{mol\,L^{-1}}. \]
الأنواع الكيميائية للكبريت هي كبريتيد الهيدروجين، \(\ce{H2S}\)، وصيغة SMILES له S؛ وأيون الهيدروجين كبريتيد، \(\ce{HS-}\)، وصيغة SMILES له [SH-]؛ وأيون الكبريتيد، \(\ce{S^2-}\)، وصيغة SMILES له [S-2].
اتزانا التفكك الحمضي لها هما
\[ \ce{H2S(aq) <=> H+(aq) + HS-(aq)} \]
و
\[ \ce{HS-(aq) <=> H+(aq) + S^2-(aq)}. \]
بضرب تعبيري الاتزان نحصل على
\[ K_{\mathrm{a1}}K_{\mathrm{a2}} = \frac{[\ce{H+}]^2[\ce{S^2-}]}{[\ce{H2S}]}. \]
ومن ثم،
\[ [\ce{S^2-}] = \frac{K_{\mathrm{a1}}K_{\mathrm{a2}}[\ce{H2S}]} {[\ce{H+}]^2}. \]
صيغة SMILES للمكوّنات الأيونية لكبريتيد النيكل(II)، \(\ce{NiS}\)، هي [Ni+2].[S-2]؛ وتفاعل ترسيبه هو
\[ \ce{Ni^2+(aq) + S^2-(aq) -> NiS(s)}. \]
عند بدء الترسيب،
\[ [\ce{Ni^2+}][\ce{S^2-}]=K_{\mathrm{sp}}. \]
إذن، تركيز الكبريتيد المطلوب هو
\[ [\ce{S^2-}]_{\mathrm{crit}} = \frac{4.0\times10^{-20}}{1.9474\times10^{-4}} = 2.0540\times10^{-16}\ \mathrm{mol\,L^{-1}}. \]
باستخدام تركيز الإشباع المحدّد \([\ce{H2S}]=0.1\ \mathrm{M}\)،
\[ \begin{aligned} [\ce{H+}] &= \sqrt{ \frac{K_{\mathrm{a1}}K_{\mathrm{a2}}[\ce{H2S}]} {[\ce{S^2-}]_{\mathrm{crit}}} }\\ &= \sqrt{ \frac{(9.6\times10^{-8})(1.3\times10^{-14})(0.1)} {2.0540\times10^{-16}} }\\ &=7.7948\times10^{-4}\ \mathrm{mol\,L^{-1}}. \end{aligned} \]
وبالتالي،
\[ \boxed{\mathrm{pH}_{\min} =-\log_{10}(7.7948\times10^{-4}) =3.108\approx3.11}. \]
تؤدي زيادة الأس الهيدروجيني إلى زيادة تركيز الكبريتيد، ولذلك يصبح الترسيب مفضّلًا فوق هذه العتبة. لا حاجة إلى حاصل إذابة كبريتيد النحاس، لأن الخطوة 5 تنقل النيكل انتقائيًا إلى المحلول.
تمت مراجعة الحل بمقارنته بالحل الرسمي. حيثما يختلف هذا الحل عن الحل الرسمي، يحتوي الحل الرسمي على خطأ أو خطأ مطبعي.